
Get inside Wall Street with StreetInsider Premium. Claim your 1-week free trial here.
UNITED
STATES
SECURITIES
AND EXCHANGE COMMISSION
Washington,
D.C. 20549
FORM
10-K
| (Mark One) |
|
| [X] | ANNUAL REPORT PURSUANT TO SECTION 13 OR 15(d) OF THE SECURITIES EXCHANGE ACT OF 1934 |
For
the fiscal year ended June 30, 2020
OR
| [ ] | TRANSITION REPORT PURSUANT TO SECTION 13 OR 15(d) OF THE SECURITIES EXCHANGE ACT OF 1934 |
For
the transition period from _______ to _____
Commission
file number: 1-34240
COLLECTORS
UNIVERSE, INC.
(Exact
name of Registrant as specified in its charter)
| Delaware | 33-0846191 | |
| (State or other jurisdiction of Incorporation or organization) |
(I.R.S. Employer Identification No.) |
| 1610 E. Saint Andrew Place, Santa Ana, California, 92705 |
| (address of principal executive offices and zip code) |
| Registrant’s telephone number, including area code: (949) 567-1234 |
| Not Applicable |
| (Former name, former address and former fiscal year, if changed, since last year) |
Securities
registered pursuant to Section 12(b) of the Act:
| Title of Class |
Trading Symbol |
Name of each Exchange on which registered |
||
| Common Stock, par value $.001 per share |
CLCT | NASDAQ Global Market |
Securities
registered pursuant to Section 12(g) of the Exchange Act:
None
Indicate
by check mark if the registrant is a well-known seasoned issuer, as defined in Rule 405 of the Securities Act. Yes [ ]
No [X]
Indicate
by check mark if the registrant is not required to file reports pursuant to Section 13 or Section 15(d) of the Act. Yes [ ]
No [X]
Indicate
by check mark whether the registrant (1) has filed all reports required to be filed by Section 13 or 15(d) of the Securities Exchange
Act of 1934 during the preceding 12 months (or for such shorter period that the registrant was required to file such reports),
and (2) has been subject to such filing requirements for the past 90 days. Yes [X]
No [ ]
Indicate
by check mark whether the registrant has submitted electronically every Interactive Data File required to be submitted pursuant
to Rule 405 of Regulation S-T (§ 232.405 of this chapter) during the preceding 12 months (or for such shorter period that
the registrant was required to submit such files). Yes [X]
No [ ]
Indicate
by check mark whether the registrant is a large accelerated filer, an accelerated filer, a non-accelerated filer, a smaller reporting
company, or an emerging growth company. See the definitions of “large accelerated filer,” “accelerated filer,”
“smaller reporting company,” and “emerging growth company” in Rule 12b-2 of the Exchange Act.
| Large accelerated filer |
[ ] | Accelerated filer |
[ ] |
| Non-accelerated filer |
[X] | Smaller reporting company |
[X] |
| Emerging growth company |
[ ] |
If
an emerging growth company, indicate by check mark if the registrant has elected not to use the extended transition period for
complying with any new or revised financial accounting standards provided pursuant to Section 13(a) of the Exchange Act. [ ]
Indicate
by check mark whether the registrant has filed a report on and attestation to its management’s assessment of the effectiveness
of its internal control over financial reporting under Section 404(b) of the Sarbanes-Oxley Act (15 U.S.C. 7262(b)) by the registered
public accounting firm that prepared or issued its audit report. [ ]
Indicate
by check mark whether the registrant is a shell company (as defined in Securities Exchange Act Rule 12b-2). Yes [ ]
No [X]
The
aggregate market value of the outstanding shares of registrant’s common stock held by registrant’s non-affiliates,
based on the closing price of registrant’s common stock on December 31, 2019 (the last business day of registrant’s
most recently completed second fiscal quarter), as reported on the NASDAQ Global Market on that date, was approximately $204,461,000.
Shares of registrant’s common stock held by its executive officers and directors have been excluded from this calculation
as such persons may be deemed to be affiliates. The determination of affiliate status for this purpose does not reflect a determination
that any of such persons is an affiliate of the registrant for any other purpose.
APPLICABLE
ONLY TO CORPORATE ISSUERS:
Set
forth below is the number of outstanding shares of registrant’s common stock, as of the latest practicable date.
| Class | As of August 21, 2020 |
|||
| Common Stock $.001 Par Value |
9,239,911 | |||
DOCUMENTS
INCORPORATED BY REFERENCE
Except
as otherwise stated therein, Items 10, 11, 12, 13 and 14 in Part III of this Annual Report on Form 10-K (the “Annual Report”)
are incorporated by reference from registrant’s Definitive Proxy Statement, which is expected to be filed with the Securities
and Exchange Commission on or before October 28, 2020, for its 2020 Annual Meeting of Stockholders. Other information contained
in that Proxy Statement and any other related solicitation materials are not deemed to be incorporated into or filed as part of
this Annual Report.
COLLECTORS
UNIVERSE, INC.
FORM
10-K
FOR
THE FISCAL YEAR ENDED JUNE 30, 2020
TABLE
OF CONTENTS
Statements
contained in this annual report on Form 10-K (the “Annual Report”) that are not historical facts or that discuss our
expectations, beliefs or views regarding our future operations or future financial performance, or financial or other trends in
our business or markets, constitute “forward-looking statements” as defined in Section 27A of the Securities Act of
1933, as amended, and Section 21E of the Securities Exchange Act of 1934, as amended. These forward-looking statements are intended
to qualify for the safe harbor from liability established by the Private Securities Litigation Reform Act of 1995. Forward-looking
statements can be identified by the fact that they do not relate strictly to historical or current facts. Often, such statements
include the words “believe,” “expect,” “anticipate,” “intend,” “plan,”
“estimate,” “project,” or words of similar meaning, or future or conditional verbs such as “will,”
“would,” “should,” “could,” or “may.” Forward-looking statements contain estimates
or predictions about or forecasts of our future financial condition and operating results and trends in our business and markets.
Although we do not make forward-looking statements unless we believe we have a reasonable basis for doing so, those statements
are necessarily based on current information available to us. Therefore, the information contained in the forward looking statements
in this Annual Report are subject to change due to (i) future events and circumstances of which we are not currently aware and
(ii) to a number of risks and uncertainties that could cause our future financial condition or operating results to differ significantly
from those expected at the current time as described in those forward-looking statements, including the continuing impact that
the Coronavirus (“COVID-19”) may have on our business, financial condition and results of operations. Those known
risks and uncertainties are described in ITEM 1A in Part I of this Annual Report under the caption “RISK FACTORS,”
and in ITEM 7 in Part II of this Annual Report under the caption “Management’s
Discussion and Analysis of Financial Condition and Results of Operations.” Accordingly, readers of this Annual Report
are urged to read the cautionary statements and risk factors contained in this Annual Report. Also, our actual results in the
future may differ from the results expressed in the forward-looking statements included in this Annual Report, due to additional
risks and uncertainties of which we are not currently aware or which we do not currently view as material to our business or operating
results. Due to all of these uncertainties and risks, readers are cautioned not to place undue reliance on the forward-looking
statements contained in this Annual Report, which speak only as of the date of this Annual Report. We undertake no obligation
to update or revise any forward-looking statements, whether as a result of new information, future events or otherwise, except
as may be required by law or the applicable rules of the NASDAQ Global Market.
———————–
References
in this Annual Report to “Collectors Universe”, “we”, “us”, “our”, “management”
and the “Company” refer to Collectors Universe, Inc., a Delaware Corporation, and its consolidated subsidiaries.
Overview
We
provide authentication and grading services to dealers and collectors of coins, trading cards, event tickets, autographs and historical
and sports memorabilia (“collectibles”). We believe that our authentication and grading services add value to these
collectibles by enhancing their marketability and thereby providing increased liquidity to the dealers, collectors and consumers
that own and buy and sell them.
Once
we have authenticated and assigned a quality grade to a collectible, we encapsulate it in a tamper-evident, clear plastic holder,
or issue a certificate of authenticity, that (i) identifies the specific collectible; (ii) sets forth the quality grade we have
assigned to it; and (iii) bears one of our brand names and logos: “PCGS” for coins, “PSA” for trading
cards and event tickets and “PSA/DNA” for autographs and memorabilia. Additionally, we warrant our certification of
authenticity and the quality grades that we assign to the coins and trading cards that we authenticate and grade. We do not warrant
our authenticity determinations for autographs or memorabilia. For ease of reference in this Annual Report, we will sometimes
refer to coins, trading cards and other collectibles that we have authenticated or graded as having been “certified.”
We
generate revenues principally from the fees paid for our authentication and grading services. To a much lesser extent, we generate
revenues from other related service revenues, which consist of (i) the sale of advertising and click-through commissions earned
on our websites, (ii) the sale of printed publications and collectibles price guides and advertising in such publications; (iii)
the sale of membership subscriptions in our Collectors Club, which is designed to attract interest in high-value collectibles
among new collectors; (iv) the sale of subscriptions to our Certified Coin Exchange (CCE) dealer-to-dealer Internet bid-ask market
for certified coins, which offers a comprehensive one-stop source for historical U.S. numismatic information and value-added content;
and (v) collectibles trade shows that we operate, at which primarily coins are exhibited and are bought and sold by collectibles
dealers and collectors. We also generate revenues from sales of our collectibles inventory, which is comprised primarily of collectible
coins that we have purchased under our coin grading warranty program; however, those sales are not the focus, and we do not consider
them to be an integral part of, our ongoing revenue-generating activities.
We
have developed some of the leading brands in the collectibles markets in which we conduct our business:
| ● | “PCGS” (Professional Coin Grading Service), which is the brand name for our independent coin authentication and grading service; |
|
| ● | “PSA” (Professional Sports Authenticator), which is the brand name for our independent sports and trading cards authentication and grading service and; |
|
| ● | “PSA/DNA” (PSA/DNA Authentication Services), which is the brand name for our independent authentication and grading service for vintage autographs and memorabilia. |
PCGS,
PSA and PSA/DNA are among the leading independent authentication and grading services in their respective markets.
We
foster brand loyalty and stimulate demand for our services by providing information and value added content to collectors and
dealers through various means including our CCE websites, Collectors Clubs, Set RegistrySM programs, Collectors.com,
CoinFacts and PSA Collectibles Facts, collectibles population reports and price guides. We believe that by providing this information
and content we generate more knowledgeable and active collectors and dealers.
We
began offering our PCGS coin authentication and grading services in 1986 and, from inception through the fiscal year ended June
30, 2020, we have authenticated and graded approximately 44 million coins. In 1991, we launched our PSA trading cards authentication
and grading service and through June 30, 2020, had authenticated and graded approximately 37 million trading cards. In 1999, we
launched our PSA/DNA vintage autograph authentication business and in June 2004 we extended that business by introducing vintage
autograph grading services to dealers and collectors of autographed sports memorabilia.
Our
revenues are comprised principally of our authentication and grading service fees. Those fees ranged from $1 to $10,300 but averaged
$13.98 per item, based primarily on the type of collectible authenticated or graded, the turnaround times and the specific service
selected by the customer. We charge higher fees for faster turnaround times. In fiscal 2020, our coin authentication and grading
fees ranged from $1 to $10,300, and averaged $18.82, per coin. In the case of trading cards, in fiscal 2020, the authentication
and grading fees ranged from approximately $1 to $5,000 and averaged $10.27, per trading card. As a general rule, collectibles
dealers and, to a lesser extent, individual collectors, request faster turnaround times and, therefore, generally pay higher fees
for more valuable, older or “vintage” collectibles than they do for modern collectibles. See Management’s Discussion
and Analysis of Financial Condition and Results of Operations: Factors that can Affect our Revenues below.
Industry
Background
The
primary determinants of the prices of, and the willingness of sellers, buyers and collectors to purchase high-value or high-priced
collectibles, are their authenticity, quality and rarity. The authenticity of a collectible relates not only to the genuineness
of the collectible, but also to the absence of any alterations or repairs that may have been made to hide, damage or to restore
the item. The quality of a collectible relates to its state of preservation relative to its original state of manufacture or creation.
The rarity of a collectible relates to its uniqueness and depends primarily on the number of identical collectibles of equivalent
or better quality that become available for purchase from time to time. With regard to value, confirmation of authenticity generally
is required before a buyer is willing to proceed with a purchase of a high-priced collectible. Quality and rarity directly affect
value and price, with higher quality and rare collectibles generally attracting dramatically higher prices than those of lower
quality and lesser rarity. Even a relatively modest difference in quality can translate into a significant difference in perceived
value and, therefore, in price.
Until
the advent of independent third-party authentication and grading, most prospective buyers, including experienced collectibles
dealers and retailers, insisted on physically examining high-priced collectibles before consummating transactions. However, unlike
professionals in the trade, most purchasers and collectors lacked the experience and knowledge needed to determine, with confidence,
the authenticity, quality or rarity, and hence the value, of high-priced collectibles, even when they had the opportunity to examine
them physically. Therefore, they had to rely on representations made by sellers regarding authenticity, quality and rarity. For
these reasons, “buyer beware” characterized the high-value collectibles markets, and “sight-unseen” markets
for rare coins and other high-value collectibles were practically non-existent.
High-value
collectibles have been traditionally marketed at retail by dealers through direct mail, catalogues, price lists and advertisements
in trade publications, and sold and purchased by them at collectibles shows, auction houses and local dealer shops. These markets
were highly inefficient because:
| ● | they were fragmented and localized, which limited both the variety of available collectibles and the number of potential buyers; |
|
| ● | transaction costs were often relatively high due to the number of intermediaries involved; |
|
| ● | buyers usually lacked the information needed to determine the authenticity and quality and, hence the value, of the collectibles being sold; and |
|
| ● | buyers and sellers were vulnerable to fraudulent practices because they had to rely on the dealers or other sellers for opinions or representations as to authenticity, quality and rarity. |
Coin
Market. In an effort to overcome some of these inefficiencies, approximately 40 years ago, professional coin dealers began
using a numerical quality grading scale for coins. That scale ranged from 1 to 70, with higher numbers denoting a higher quality.
Previously, professional dealers used descriptive terms, such as “Fair,” “Fine” and “Uncirculated,”
to characterize the quality of the coins they sold, a practice that continued after the development of the numeric grading system.
However, whether using a numeric or a descriptive system, grading standards varied significantly from dealer to dealer, depending
on a dealer’s subjective criteria of quality. Moreover, dealers were hardly disinterested or independent since, as the sellers
or buyers of the coins they were grading, they stood to benefit financially from the assignment of a particular grade.
Trading
Cards Market. Misrepresentations of authenticity, quality and rarity also operated as a barrier to the liquidity and growth
of the collectibles market for trading cards. Even experienced and knowledgeable dealers insisted on physically examining purportedly
rare and higher-priced trading cards. Most collectors lacked the knowledge needed to purchase collectible trading cards with confidence,
even when they had physically examined them. Trading card dealers eventually developed a rudimentary adjectival system to provide
measures of quality, using descriptive terms such as “Poor,” “Very Good,” “Mint” and “Gem
Mint.” These measures of quality were assigned on the basis of such characteristics as the centering of the image on the
card and the presence or absence of bent or damaged corners, scratches and color imperfections. However, as was the case with
coins, grading standards varied significantly from dealer to dealer, depending on a dealer’s subjective criteria of quality.
Additionally, since the dealers who bought and sold trading cards were the ones that assigned these grades, collectors remained
vulnerable to misrepresentations as to the authenticity, quality and rarity of trading cards being sold or purchased by dealers.
Autographed
Memorabilia Market. The market for autographed sports, entertainment and historical memorabilia has been plagued by a high
incidence of forgeries and misrepresentations of authenticity. For example, Operation Bullpen, initiated by the FBI and other
law enforcement agencies beginning in 1997, uncovered a high volume of outright forgeries of signatures and widespread misrepresentations
as to the genuineness of sports memorabilia. We believe that the high incidence of such fraudulent activities was due, in large
part, to a dearth of independent third-party memorabilia authentication services and an absence of systematic methodologies and
specimen data needed for verification of authenticity.
These
conditions created a need and the demand for independent authentication and grading services from which sellers, purchasers and
collectors could obtain:
| ● | determinations, from independent, third-party experts, of the authenticity of the high-value collectibles that are sold and purchased by dealers and collectors, particularly “sight-unseen” or over the Internet; |
|
| ● | representations of quality based on uniform standards consistently applied by independent, third-party experts; and |
|
| ● | authoritative information, compiled by a credible third party, to help purchasers and collectors understand the factors that affect an item’s perceived value and price, including: |
| — | its rarity; |
|
| — | its quality or grade; and |
|
| — | its historical and recent selling prices. |
The
Impact of eBay and Other e-Commerce Websites on the Collectible Markets. The advent of the Internet and, in particular, eBay’s
development of an Internet or “virtual” marketplace and other Internet-selling websites, such as Amazon, have overcome
many of the inefficiencies that had characterized the traditional collectibles markets. eBay and other online marketplaces (i)
offer enhanced interaction between and greater convenience for sellers and buyers of high-value collectibles; (ii) eliminate or
reduce the involvement of dealers and other “middlemen;” (iii) reduce transaction costs; (iv) allow trading to be
conducted at all hours; and (v) regularly provide updated information to collectors. In addition, in August 2015, the Company
launched its Collectors.com website where it aggregates and organizes collectibles listings from sellers and collectibles categories
and markets; to enable collectors to expeditiously locate collectibles they are interested in buying. However, Internet commerce
still raises, and has even heightened, concerns about the authenticity and quality of the collectibles that are listed for sale
on the Internet. Buyers have no ability to physically examine the collectibles and no means to confirm the identity or the credibility
of the dealers or sellers on the Internet. As a result, we believe that the growth of Internet-selling websites, such as eBay
and Amazon, and individual dealer-owned websites, has increased awareness of the importance of, and the demand for, independent
third-party authentication and grading services of the type we provide. Our services enable purchasers and collectors to use the
Internet to purchase high-value collectibles, without physical examination (“sight-unseen”), with the confidence of
knowing that they are authentic and are of the quality represented by sellers. The importance and value of our services to purchasers
and collectors, we believe, are demonstrated by eBay’s inclusion, on its collectibles websites, of information that identifies,
and encourages visitors to use, our independent third-party authentication and grading services, as well as similar services offered
by some of our competitors.
Our
Services
PCGS
Coin Authentication and Grading Services. Recognizing the need for third-party authentication and grading services, we launched
Professional Coin Grading Service in 1986. PCGS employs or retains the services of expert coin graders, who are independent of
coin buyers and sellers, to provide impartial authentication and grading services. We also established uniform standards of quality
measured against an actual “benchmark” set of coins kept at our offices. We place each coin that we authenticate and
grade in a tamper-evident, clear plastic holder which bears our logo, so that any prospective buyer will know that it is a PCGS
authenticated and graded coin. We also provide a warranty as to the accuracy of our coin authentication and grading determinations.
As of June 30, 2020, we employed or retained the services of 39 coin experts who have an average of 11 years of service with the
Company.
By
providing an independent assessment by coin experts of the authenticity and quality of coins, we believe that PCGS has increased
the liquidity of the trading market for collectible coins. Following the introduction of our independent, third-party authentication
and grading service, buyer confidence, even between dealers, increased to such a degree that coins authenticated and graded by
PCGS were able to be traded “sight-unseen.” In 1990, a dealer market was developed, known as Certified Coin Exchange,
(“CCE”) on which coin dealers trade rare coins “sight-unseen.” We acquired CCE in 2005.
Our
coin authentication and grading services have facilitated the development of a growing Internet or “virtual” marketplace
for collectible coins. A prospective buyer, who might otherwise be reluctant to purchase a high-priced coin listed “sight-unseen”
on the Internet, is able to rely on a PCGS certification, as well as authoritative information about the coin that is accessible
on our website or smartphone applications, in deciding whether or not to bid and in determining the amount to offer for the coin.
As a result, to enhance the marketability of higher-priced coins, many sellers submit their coins to PCGS for authentication and
grading. That enables the sellers to include, in their Internet sales listings, digital images of the coins in their tamper-evident,
clear plastic holders, which identify the coins as having been authenticated and graded by PCGS, as well as their PCGS-assigned
grades. We also provide a range of authoritative content on coin collecting to inform and communicate with the collector community,
including guides and reports that track the trading prices and the rarity of PCGS-graded coins.
PSA
Trading Card Authentication and Grading Services. Leveraging the credibility and using the methodologies that we had established
with PCGS in the coin market, in 1991 we launched Professional Sports Authenticator (PSA), which instituted a similar authentication
and grading system for trading cards. We are now the leading authenticator and grader of trading cards. Our independent trading
card experts certify the authenticity of and assign quality grades to trading cards using a numeric system with a scale from 1-to-10
that we developed, together with an adjectival system to describe their condition. As of June 30, 2020, we employed 33 experts
who have an average of 14 years of service with the Company. We believe that our authentication and grading services have removed
barriers that were created by the historical seller-biased grading process and, thereby, have improved the overall marketability
of and facilitated commerce in trading cards, including over the Internet and at telephonic sports memorabilia auctions.
The
trading cards submitted to us for authentication and grading include primarily (i) older or vintage trading cards, particularly
of memorable or historically famous players, such as Honus Wagner, Joe DiMaggio, Ted Williams and Mickey Mantle, and (ii) modern
or newly produced trading cards of current or new athletes who have become popular with sports fans or have achieved new records
or milestones, such as Derek Jeter, Albert Pujols, Mariano Rivera and Miguel Cabrera. These trading cards have, or are perceived
to have, sufficient collectible value and are sold more frequently than are trading cards of less notable athletes, leading dealers
and collectors to submit them for grading to enhance their marketability. Also, the production and sale of each new series of
trading cards, which take place at the beginning and during the course of each new sports season, create new collectibles that
provide a source of future additional authentication and grading submissions to us.
PSA/DNA
Autograph Authentication and Grading Services. In 1999, we launched our vintage autograph authentication business, initially
offering authentication services for “vintage” sports autographs and memorabilia that were autographed or signed prior
to the time they were presented to us for authentication. The vintage autograph authentication business is distinctly different
from the “signed-in-the-presence” authentication of autographs where an “authenticator” is present and
witnesses the actual signing. Our vintage autograph authentication service involves the rendering of an opinion of authenticity
by an industry expert based on (i) an analysis of the signed object, such as the signed document or autographed item of memorabilia,
to confirm its consistency with similar materials or items that existed during the signer’s lifetime; (ii) a comparison
of the signature submitted for authentication with exemplars of such signatures; and (iii) a handwriting analysis. As of June
30, 2020, we employed five autograph experts, as well as outside consultants that we sometimes use on a contract basis.
In
June 2004, we also began offering grading services for autographs, beginning with baseballs containing a single signature or autograph.
We use uniform grading standards that we have developed and a numeric scale of 1-to-10, with the highest number representing top
quality or “Gem Mint” condition. We assign grades to the collectibles based on the physical condition or state of
preservation of the autograph.
CCE
Certified Coin Exchange and Collectors Corner. In September 2005, we acquired the Certified Coin Exchange (CCE), a subscription-based,
business-to-business Internet bid-ask market for coins that have been certified by us or by other independent coin authentication
and grading services. The CCE website now features over 100,000 bid and ask prices for certified coins at www.certifiedcoinexchange.com.
CCE, since 1990, has provided liquidity in the geographically dispersed and highly fragmented market for rare coins. In March
2007, we introduced the Collectors Corner, a business-to-consumer website that enables sellers on CCE to offer many certified
coins simultaneously at wholesale prices on CCE and at retail prices on Collectors Corner (www.collectorscorner.com). Registration
on Collectors Corner is free for consumers, who can search for and sort coins listed on the Collectors Corner website. Coin sellers
must register and pay a fixed monthly subscription fee to us for access to and to effectuate sale transactions on both CCE and
Collectors Corner. Currently, there are over 180,000 collectibles, consisting primarily of coins, trading cards, currency and
stamps, which are offered for sale on Collectors Corner, with offering prices aggregating approximately $330 million. The enhanced
liquidity provided by CCE and Collectors Corner for certified coins, trading cards, and certified stamps, has increased the volume
and turnover of these items, which benefits us because, as a general rule, increases in sales and purchases of those collectibles
increase the demand for our authentication and grading services.
Publications
and Advertising. We publish authoritative price guides, rarity reports and other collectibles data to provide collectors with
information that makes them better informed consumers and makes collecting more interesting and exciting. Our publications also
enable us to market our services, to create increased brand awareness and to generate advertising revenues. We publish the Sports
Market Report on a monthly basis and the Rare Coins Market Report on a 2-month basis primarily for distribution to
approximately 31,000 Collectors Club members. We sell advertising to dealers and vendors for placement in our publications. We
manage a Collectors Universe website and individual websites for our authentication and grading services. On those websites, we
offer collectible content, relevant to the marketplace for the specific authentication and grading service. We believe our websites
for PCGS in coins, and PSA in trading cards, have the highest number of visitors and web traffic in their respective markets.
We sell advertising to dealers and vendors on these two websites and on the websites, we maintain for PSA/DNA in autographs and
CCE and Collectors Corner in coins.
Collectible
Trade Shows. We own Expos Unlimited LLC (“Expos”) a trade show management company that operates one of the larger
coins and collectibles shows, staged in Long Beach, California, three times a year. At these shows, collectibles are exhibited
and are bought and sold by collectibles dealers and collectors. See Recent Developments: Coronavirus (“COVID-19”)
under Item 7 Management’s Discussion and Analysis of Financial Condition and Results of Operations.
Our
Mission
Our
mission is to provide the finest available independent authentication and grading services to sellers and buyers of high-value
collectibles in order to:
| ● | increase the values and liquidity of collectibles; |
|
| ● | enable and facilitate transactions in collectibles; |
|
| ● | generally, enhance interest, activity and trading in collectibles; and |
|
| ● | achieve profitable growth, build long-term value for our stockholders and provide rewarding opportunities for our employees. |
Our
Growth Strategy
We
have established leading brands in our existing collectibles markets, including PCGS, PSA and PSA/DNA. We use those brands to
promote Collectors Universe as the premier independent provider of authentication and grading services in the collectibles markets,
in order to (i) increase our market share among existing users of authentication and grading services, (ii) increase the use of
our services by the numerous collectors that do not currently use any independent third-party authentication or grading services,
and (iii) expand our coin and trading cards services to selected international markets.
Although
we have authenticated and graded approximately 44 million coins since the inception of PCGS, and approximately 37 million trading
cards since the inception of PSA, we believe that less than 10% of the vintage United States coins and less than 10% of the vintage
trading cards have been authenticated and graded by independent providers of authentication and grading services. Additionally,
we estimate that we have authenticated and graded less than 10% of the potential market of autographs in the United States. Moreover,
new collectibles are introduced each year into the markets in which we operate, some of which are authenticated and graded in
the year of their introduction. Over time, these collectibles will increase the supply of vintage items that are sold by dealers
and collectors, and we expect that many of them will be submitted for independent authentication and grading.
To
take advantage of market opportunities to expand our service offerings to customers and to solidify our position as a leading
authority in the collectible markets that we serve, we have:
| ● | increased and will continue to increase operational capacity to enable us to authenticate and grade a higher number of primarily collectible cards, in response to continued increased demand for our services. This involves adding additional operating personnel, reviewing and improving our operational processes, introducing multiple daily work shifts and making additional operational space available. |
| ● | begun embedding high-security Near Field Communication (NFC) chip technology into PCGS coin holders that allow collectors and dealers with a modern smartphone to verify that the coin encapsulated within the holder is a genuine PCGS certified coin. |
|
| ● | expanded our geographical reach by opening offices in France, Japan, Hong Kong and China, the operations of which, in total, accounted for approximately 10% of our net revenues in fiscal 2020; |
|
| ● | provided special packaging on certain modern coin programs that enhances the value of commemorative coins and helps drive increased volumes of coins sold by dealers and distributors of those coins; |
|
| ● | provided collectibles information and value-added content through our online encyclopedia- CoinFacts and PSA Collectible Facts, as well as through printed publications; |
|
| ● | participated at collectibles industry trade shows and organized “members only” shows for PCGS authorized dealers and Collectors Club members, at which we offer on-site authentication and grading services to facilitate collectibles trading activities; |
|
| ● | established authorized PCGS and PSA dealer networks to increase the visibility of our brands and the use of our services by those dealers and their customers; |
|
| ● | continued to enhance our Set RegistrySM programs to increase demand for our collectible coin and trading card authentication and grading services, among collectors and to increase traffic on our websites; |
|
| ● | promoted our Collectors Clubs to attract and to provide incentives for collectors to use our services, and |
|
| ● | expanded our website information services, to include auction results, reference materials and ongoing collectibles price guides and population reports. |
Operations
We
offer authentication and grading services for coins, trading cards, autographs and autographed memorabilia. Our trained and experienced
authentication and grading experts determine the authenticity of and using uniform quality standards, assign quality grades to
these collectibles.
PCGS.
Our authentication and grading of coins involves an exacting and standardized process. We receive coins from dealers and collectors
and remove all packaging that identifies the submitter in any way. We then enter information regarding each coin into our proprietary
computerized inventory system, which tracks the coin at every stage of the authentication and grading process. Generally, our
process requires that at least two of our experts evaluate each coin independently. In some cases, depending on the type of coin
being authenticated and graded or on the results of the initial review process, we involve a third expert to make the final determinations
of authenticity and grade. The coin’s authenticity and grade are then verified by one of our senior experts, who has the
authority to resubmit the coin for further review if he or she deems it to be necessary. Only after this process is complete is
the coin reunited with its identifying paperwork, thus keeping the authentication and grading process from being influenced by
the identity of the owner and the history of the coin. The coin is then sonically sealed in our specially designed, tamper-evident,
clear plastic holder, which also encases a label describing the coin, the quality grade that we have assigned to it, a unique
certificate number, the PCGS hologram and brand name and if requested by the customer, special inserts that can enhance the collectible
value of the coin.
PSA.
On receipt of trading cards from dealers and collectors, we remove all packaging that identifies the submitter in any way and
enter information regarding the trading card into our proprietary computerized inventory system that enables us to track the trading
cards throughout the authentication and grading process. Only after the authentication and grading process is complete is the
trading card reunited with its identifying paperwork, thus keeping the authentication and grading process independent of the identity
of the owner and the history of the trading card. The trading card is then sonically sealed in our specially designed, tamper-evident,
clear plastic holder, which also encases a label that identifies the trading card, the quality grade that we have assigned to
it and a unique certificate number, and the PSA hologram and brand name. We primarily authenticate and grade sportscards and,
to a lesser extent, entertainment, as well as other types of collectible cards that are growing in popularity.
PSA/DNA.
Because of the variability in the size of autographed memorabilia, the authentication and grading procedures we use necessarily
differ from those used in authenticating and grading coins and trading cards. Customers may ship the autographed memorabilia to
us for authentication at our offices or, in the case of dealers or collectors that desire to have a large number of items authenticated,
we will sometimes send an expert to the customer’s location for “on-site” examination and authentication. Our
experts reference what we believe is one of the largest databases of known genuine exemplars of signatures for comparison to a
submitted item and draw upon their training and experience in handwriting analysis. In most cases, we take a digital photograph
of the autographs that we have authenticated and store those photographs in a master database. Before shipping the item back to
the customer, a tamper-evident label is affixed to the collectible at the customer’s option. The label contains our PSA/DNA
name and logo and a unique certificate number. For additional security, in all cases when an item is fully authenticated, we tag
the items with synthetic DNA-laced ink, which is odorless, colorless and tasteless and visible only when exposed to a narrow band
wavelength of laser light using a hand-held, battery-powered lamp. Additional verification that an autographed item was authenticated
by us can be obtained by using a chemical analysis to determine whether or not the ink used in the unique DNA code by PSA/DNA
was applied to the autographed item. As a result, if the tamper-evident label that we affixed to an autographed item were to be
removed or otherwise separated from the item, it is still possible to verify that the item was authenticated by us.
Marketing
We
employ both “pull” and “push” strategies in marketing our services to dealers and collectors of high-value
collectibles. For collectibles, our “pull” strategies are designed to promote our brands, increase the preference
among collectors for our authentication and grading services and encourage collectors to communicate that preference to their
collectibles dealers, because most authentication and grading submissions are made by dealers. In our experience, if a customer
requests a particular grading service, the dealer ordinarily will comply with that request. On the other hand, if the customer
expresses no preference, the dealer will make its own choice of authentication and grading service or may even decide not to submit
the collectible to an independent service for authentication and grading. Therefore, our “pull” oriented marketing
programs emphasize (i) the protections that collectors and retail customers will have if they purchase collectibles that we have
authenticated and graded; and (ii) the improved marketability and higher prices that they and the associated retailers can realize
if they use our independent third-party authentication and grading services. Our “push” strategy, on the other
hand, is designed to market our services directly to collectibles dealers to encourage them to use and promote our services.
Our
“Pull” Strategy. We have developed and implemented a number of marketing programs and initiatives designed to
create consumer preference for collectibles that have been authenticated and graded by us. Those programs and initiatives include:
| ● | Set Registry Programs. We provide collectors with the opportunity to participate in free Internet “Set Registry” programs that we host on our collectibles websites. These programs encourage collectors to assemble full sets of related collectibles that have been authenticated and graded by us. Generally, each registered set is comprised of between 50 and 200 separate, but related, collectibles. Examples include particular issues of coins, such as Twenty Dollar Gold Double Eagles or Morgan Silver Dollars; particular sets of trading cards, such as all Hall of Fame pitchers or a particular team, like the 1961 Yankees. Our Set Registry programs enable collectors: |
| — | to register their sets on our websites, which provides them with an off-site reference source for insurance and informational purposes; |
|
| — | to display on our websites, and compare the completeness and quality grades of the collectibles making up their sets to those of other collectors who have registered similar sets on our websites, thereby creating a competitive aspect to collecting that adds to its excitement; and |
|
| — | to enter our annual Company-sponsored Set Registry competitions and awards programs in which collectors can win awards for having collected the most complete and highest graded sets of particular series or issues of coins or trading cards. |
The
collectibles that may be registered on our Set Registries and included in our Set Registry competitions are generally limited
to collectibles that have been authenticated and graded by us, although in November 2019 we began allowing collectors to build
collections of PCGS-graded coins that have also been approved by Certified Acceptance Corporation (CAC). To register the collectibles
to be included in a particular set, a collector is required to enter the unique certificate number that we had assigned to each
of the collectibles when last authenticated and graded by us. We use the certificate number to compare the information being submitted
by the collector with our database of information to verify that the collectibles being registered by a participant for inclusion
in a particular set, qualify to be included in that set. We have found that our Set Registry competitions (i) create a preference
and increase demand among collectors for our brands, and (ii) promote the trading of collectibles authenticated and graded by
us by set registrants seeking to improve the completeness and overall quality of their sets, which generally results in additional
authentication and grading submissions to us. Annual awards for set completeness and quality have been issued by PCGS and PSA
each year since 2002. As an indication of the increasing popularity of our Set Registry programs, approximately 295,000 sets were
registered on our Set Registries as of June 30, 2020, which represents a 16% increase over the number registered as of June 30,
2019.
| ● | Collectors Club Subscription Program. We also have established “Collectors Clubs” for coin and trading card collectors. For an annual membership fee, ranging from $59 to $249, collectors receive a number of benefits, including (i) the right to have, without any further charge, a specified number of collectibles authenticated and graded by us, a privilege that non-member collectors do not have; and (ii) access to certain proprietary data that we make available on our websites or in print. At June 30, 2020, there were approximately 31,000 members in our Collectors Clubs. |
|
| ● | Certified Coin Exchange (“CCE”) Business-to-Business Website and Collectors Corner Business-to-Consumer Website. The CCE website is a business-to-business website where recognized dealers make markets in and can sell and purchase coins and other collectibles that have been certified by us or by other independent coin grading services. Currently, there are over 180,000 certified coins being offered at bid and ask prices. We believe that the liquidity created for certified coins by CCE increases the demand for PCGS certified coins among dealers. In addition, we provide a market on Collectors Corner, which is a business to consumer website where consumers can identify and purchase coins, trading cards and currency offered for sale by authorized dealers. We believe that Collectors Corner has advantages over other business-to-consumer websites because the counterparties to the consumers, who buy and sell collectibles via Collectors Corner, have been accepted as sellers on the Collectors Corner website and are known members in the collectibles markets and the collectibles selling communities. Collectibles are listed at fixed prices, with the opportunity to negotiate lower prices. We believe that the increased turnover offered for collectibles listed on Collectors Corner, as well as the ability to use Collectors Corner to improve a coin or trading card set in the PCGS and PSA Set Registries, respectively, creates increased brand preference for PCGS and PSA authenticated and graded collectibles. |
Our
“Push” Strategy. We also market our services directly to collectibles dealers and auctioneers to promote their
use of our authentication and grading services. Our marketing message is focused on the enhanced marketability of collectibles
that we have certified due to the increase in customer confidence that is attributable to our independent authentication and grading
of those collectibles. These marketing programs include:
| ● | Trade Shows and Conventions. There are numerous collectibles trade shows and conventions held annually in the United States and overseas, where collectibles dealers gather on a trading floor to buy and sell collectibles. We attend the largest and most significant of those trade shows and conventions, at many of which we offer same-day on-site authentication and grading services, which facilitate the trading and sales of collectibles at these shows and conventions. At the same time, we obtain additional brand exposure and generate increased revenues, because dealers and collectors generally are willing to pay higher fees for same- day on-site authentication and grading services at such trade shows and conventions. See Recent Developments: Coronavirus (COVID-19) under Item 7 Management’s Discussion and Analysis of Financial Condition and Results of Operations. |
|
| ● | Expos. We own Expos Unlimited LLC (“Expos”), a trade show management company that operates one of the larger and better-known coin and collectibles shows staged, three times a year, in Long Beach, California. Those shows enable us to showcase our services and expertise better than at trade shows that we do not own or operate. In addition, Expos assures us of the continued availability of this show venue for our onsite authentication and grading services. See Recent Developments: Coronavirus (COVID-19) under Item 7 Management’s Discussion and Analysis of Financial Condition and Results of Operations. |
| ● | Authorized Dealer Network. We have implemented authorized dealer programs for coin and trading card collectibles dealers and auction companies. Authorized dealers are able to use our marketing materials which are designed to promote our services and those of our authorized dealers to collectors. Those materials include “point of sale” and “point of purchase” displays and brochures and direct mail pieces for insertion in customer mailings. In addition, authorized dealers may use our brand logotypes on their websites to attract buyers for coins and trading cards that have been authenticated and graded by us. We also conduct joint marketing programs with our authorized dealers in which we provide financial support for dealer marketing programs, approved by us, that promote both the dealer’s products and services and our authentication and grading services. |
Intellectual
Property
Our
intellectual property consists primarily of trademarks, copyrights, proprietary software and trade secrets. As part of our confidentiality
procedures, we generally enter into agreements with our employees and consultants and limit access to, and distribution of, our
software, documentation and other proprietary information.
The
following table sets forth a list of our trademarks, both registered and unregistered, that are currently being used in the conduct
of our business both in the United States and overseas:
| Registered Marks |
Unregistered Marks |
|||
| Collectors Universe |
PSA | Coin Universe |
||
| Professional Coin Grading Services |
PSA/DNA | Collectors.com | ||
| PCGS | Quick Opinion |
Expos Unlimited |
||
| PCGS Secure |
PSA Cardfacts |
Long Beach Coin, Stamp and Collectibles Expo |
||
| PCGS Gold Shield |
PSA CollectibleFacts |
Early Find |
||
| First Strike |
Sports Market Report |
|||
| CoinFacts | Set Registry |
|||
| Mobile CoinFacts |
Rookie Ball and Graph |
|||
| PCGS3000 | Certified Coin Exchange |
|||
| History in Your Hands |
Coinflation | |||
| PCGS Currency |
CCE | |||
| PCGS Banknote |
Collectors Corner |
|||
| Professional Currency Grading |
FACTS | |||
| Professional Sports Authenticator |
SPOTS DATA |
|||
We
have not conducted an exhaustive search of possible prior users of the unregistered trademarks listed above, and therefore it
is possible that our use of some of these trademarks may conflict with others.
Collectibles
Experts
As
of June 30, 2020, we employed 77 experts in our authentication and grading operations, with an average of 12 years of service
with the Company. Our experts include individuals that either (i) had previously been collectibles dealers or were recognized
as experts in the markets we serve, (ii) have been trained by us in our authentication and grading methodologies and procedures,
or (iii) had gained authentication and grading experience at competing authentication and grading companies. However, talented
collectibles authentication and grading experts are in short supply, and there is considerable competition among collectibles
authentication and grading companies for their services. As a result, we focus on training young authenticators and graders (including
non-US individuals) who we believe have the skills or knowledge base to become collectibles experts. We also contract with outside
experts, usually collectibles dealers, to assist us with special grading issues or to enable us to address short-term increases
in authentication and grading orders.
Service
Warranties
We
generally issue an authenticity or grading warranty with every coin and trading card authenticated or graded by us. Under the
terms of the warranty, in general, if a coin or trading card that was authenticated
or graded by us later receives a lower grade upon resubmission to us for grading, or is determined not to be authentic, based
on our opinion, we will offer either to purchase the coin or trading card at the current market value at the originally assigned
grade or, instead, at the customer’s option, to pay the difference in the current market value of the item between
its original assigned grade and its lower grade. We accrue for estimated warranty costs based on historical claims experience,
and we monitor the adequacy of the warranty reserves on an ongoing basis. If warranty claims were to increase in relation to historical
trends and experience, we would increase the warranty reserve and incur additional charges that would have the effect of reducing
income in those periods during which the warranty reserve is increased. See ITEM 7: “Management Discussion and Analysis
of Financial Condition and Results of Operations-Critical Accounting Policies: Grading Warranty Costs”, and ITEM
8: Consolidated Financial Statements -Note 6 of this report for more information regarding our warranty reserves. As discussed
above, before returning an authenticated or graded coin or trading card to our customer, we place the coin or trading card in
a tamper-evident, clear plastic holder that encapsulates a label identifying the collectible as having been authenticated and
graded by us. The warranty is voided if the plastic holder has been broken or damaged or shows signs of tampering.
We
do not provide a warranty with respect to our opinions regarding the authenticity or quality of autographs or memorabilia.
Customer
Service and Support
We
devote significant resources to customer services, including a 44-person staff that provides personalized customer service and
support in a timely manner, while also supporting our Set Registry, trade show programs and overseas offices. On our websites,
customers are able to check the status of their collectibles submissions throughout the authentication and grading process and
to confirm the authenticity of the collectibles that we have graded. When customers need services or have any questions, they
can telephone or e-mail our support staff, Monday through Friday between the hours of 7:00 a.m. and 5:00 p.m., Pacific Time. We
also involve our collectibles experts in providing support services, when necessary, to address special issues.
Supplies
In
order to obtain volume discounts, we have chosen to purchase the injection-molded critical high-volume plastic parts for our clear
plastic holders from a limited number of suppliers. We typically concentrate the purchase of holders through one supplier when
developing new holders, although, we now have back up suppliers and dies for our critical parts. If it became necessary for us
to obtain parts from an additional supplier, we would have to arrange for the fabrication of a die for that new supplier, which
can be a lengthy process. However, as we own the dies used to manufacture the parts, they should be able to be moved to replacement
suppliers. We believe the inventory of parts we maintain and the availability of back-up suppliers (including overseas suppliers)
is sufficient to give us the time to change suppliers, if considered necessary.
Competition
Coin
Authentication and Grading. Our principal competitors in the coin authentication and grading market are Numismatic Guaranty
Corporation of America (“NGC”), Independent Coin Grading, Certified Acceptance Corporation (“CAC”) and
ANACS, all of which are privately owned businesses.
Trading
Card Authentication and Grading. Our primary competitors in trading card authentication and grading are Beckett Trading Card
Grading Corporation, and Trading Card Guaranty, LLC.
Autograph
Authentication and Grading. In the vintage autograph authentication market, we compete with James Spence Authentication and
a few smaller competitors.
We
believe that the principal competitive factors in our collectibles authentication and grading markets are (i) brand recognition
and awareness; (ii) an established reputation for integrity, independence and consistency in our approach to establishing authenticity
and in the application of grading standards; and (iii) responsiveness of service. We have found that price is much less of a factor
in the case of vintage collectibles, but is a more important consideration with respect to modern coins and trading cards because
of their significantly lower values. We believe that our PCGS, PSA and PSA/DNA brands compete favorably with respect to all of
these factors and are among the leaders in each of their respective markets. Barriers to entry into the authentication and grading
market are relatively low, especially in the trading card authentication and grading market. However, brand name recognition and
a reputation for integrity, independence and consistency in the application of grading standards can take several years to develop.
In addition, we believe that the sheer number of coins and cards that are in PCGS and PSA holders acts as a barrier to entry to
new competitive start-up brands. The limited supply of experienced collectibles experts also operates as a barrier to entry.
Information
Technology
IT
Systems. We have developed a number of proprietary software systems for use in our authentication and grading operations,
as well as for the operation and maintenance of our websites. Custom applications include grading systems, inventory control and
order tracking systems, and other internally developed applications to manage the day-to-day operations of the Company. Websites
have multiple customer-facing content/information systems, including (but not limited to) PSA CollectibleFacts, PCGS CoinFacts,
multiple price guide and population reports, and multiple eCommerce solutions. Internally, these websites and applications are
managed through a proprietary content management system. The majority of internally developed systems are written in Microsoft
C# .NET and, in some limited cases, Microsoft Visual Basic .NET (all using a number of high-availability virtual machine systems
or Microsoft SQL Server clusters on the back end).
The
majority of the information technology systems (both for internal use and on publicly-accessible websites) are located at a Statement
on Standards for Attestation Engagements (“SSAE”) 18 compliant data center in Southern California. This data center
offers:
| ● | 24/7/365 monitoring and alerting of environmental conditions (including temperature, humidity, power status, etc.) through multiple/redundant hardware sensors and systems; |
|
| ● | 24/7/365 physical security through both technology (cameras, sensors, biometric access control, etc.) and always-present security staff; and |
|
| ● | redundant Internet connectivity, power, and cooling systems that are tested on a regular basis. |
We
also maintain a number of systems to monitor the availability and performance of our sites and systems, including:
| ● | 24/7/365 monitoring and alerting of website availability and performance through both internally developed and third-party solution providers; and |
|
| ● | 24/7/365 monitoring and alerting of Internet-based security threats through internal security systems, dedicated hardware devices, and external third-party solution providers. |
In
addition to the Southern California data center, smaller internal-use-only local area networks exist in our Southern California,
New Jersey, Paris, Shanghai, Hong Kong, and Japan operations centers. However, the Information Technology infrastructure
in those smaller offices is limited. Therefore, any damage to, or failure of, our computer systems due to a catastrophic event
in Southern California, such as an earthquake, could cause an interruption in our services. We believe that these risks are mitigated
by a comprehensive data backup/protection solution, which includes regular rotation of offsite data storage.
Cyber
Security. Cyber security is one of our top priorities and is always contemplated when developing and deploying new systems
(both software and hardware). To this end, key staff members maintain industry-standard security and audit certifications and
regularly expand their security knowledge and deploy new security tools as considered necessary.
We
maintain multiple Internet connections for both web serving and outbound Internet access. Internet access points (across all offices)
are protected with Palo Alto enterprise-level firewalls and security products. Additional security features include limiting access
to critical infrastructure components through next generation end point protection that includes dynamic machine learning capabilities
and predictive models. In addition to the constant monitoring of these security devices, network security scans (of both internal
and publicly-accessible servers) are performed on a regular basis. These scans include penetration/intrusion testing, vulnerability
assessments, and attack surface analysis. We have multiple overlapping security infrastructures to mitigate potential single failures.
However, as many other businesses have experienced, there can be no assurance that the security measures we have adopted will
prove to be adequate to enable us to detect and prevent all cyber-security breaches that could lead to the theft by hackers of
confidential information entrusted to us by our customers, including passwords and credit card numbers. See “Risk
Factors-Our business is subject to online security risks, including security breaches” in ITEM 1A below in this Annual
Report.
Government
Regulation
With
the exception of laws in some states that require memorabilia authenticators to certify to the accuracy of their authentication
opinions, there are no material government regulations specifically relating to the authentication and grading businesses that
we conduct, other than regulations that apply generally to businesses operating in the markets where we maintain operations or
conduct business.
Employees
As
of June 30, 2020, we had a total of 515 employees, of which 446 were full-time employees and 69 were
part-time employees, including 49 who were employed outside of the United States. Our authentication
and grading-related businesses employed 448 people, including our 77 experts and 44 customer
service and support personnel. Of the other 67 employees, 22 work in information services, 6 in our CCE subscription business,
6 in our Expos business (of which 5 were part-time employees), and 33 in other business
and administrative services. We have never had a work stoppage due to an employee dispute, and no employees are represented under
collective bargaining agreements. We consider relations with our employees to be good.
Available
Information
Our
internet address is www.collectorsuniverse.com. We post links to our website to the following filings as soon as reasonably
practicable after they are electronically filed with or furnished to the SEC: annual reports on Form 10-K, quarterly reports on
Form 10-Q, current reports on Form 8-K, proxy statements, and any amendments to those reports filed or furnished pursuant to Section
13 or 15(d) of the Securities Exchange Act of 1934, as amended. All such filings are available through our website free of charge.
Our SEC filings may also be read and copied at the SEC’s Public Reference Room at 100F Street, NE, Washington, DC 20549.
Information on the operation of the Public Reference Room may be obtained by calling the SEC at 1-800-SEC-0330. The SEC also maintains
an internet site at www.sec.gov that contains reports, proxy and information statements, and other information regarding issuers
that file electronically with the SEC. Our websites and the information contained thereon are not part of, nor are they incorporated
into, this Report.
Our
business is subject to a number of risks and uncertainties that could prevent us from achieving our business objectives and could
hurt our future financial performance and the price performance of our common stock. Such risks and uncertainties, many of which
are outside of our control, could also cause our future financial condition and future financial performance to differ significantly
from our current expectations, which are described in the forward-looking statements contained in this Annual Report. Those risks
and uncertainties, many of which are outside of our control, include the following:
The
COVID-19 pandemic has had and may continue to have, and other public health crises or epidemics could in the future have, a material
adverse impact on our business, operations, liquidity, financial condition, results of operations, and the markets and communities
in which we operate.
The
COVID-19 pandemic has had, and other public health crises or epidemics in the future could have, repercussions across local, regional,
and global economies and financial markets. The outbreak of COVID-19 has significantly adversely impacted global economic activity
and contributed to volatility in and negative pressure on financial markets. In response to the pandemic, many federal, state,
local and foreign governments have put in place, and others in the future may put in place, travel restrictions, quarantines,
stay-at-home orders, and similar government orders and restrictions in an attempt to control the spread and mitigate the impact
of the disease. Such restrictions or orders, or the perception that such restrictions or orders could be implemented or extended,
have resulted in business closures, work stoppages, slowdowns and delays, work-from-home policies, and cancellation or postponement
of events and trade shows, among other effects that have impacted and could continue to negatively impact our business and operations.
For
example, during our third quarter ended March 31, 2020, we suspended our coin, trading card and memorabilia authentication and
grading operations in California in response to statewide stay-at-home orders, which contributed to a material adverse impact
to our revenues and operating income. Although we resumed such operations, as an essential services provider, and allowed our
employees to return to work, future government restrictions or orders may require we temporarily cease or limit our operations
in California or other geographic regions in which we operate, which could further impact our business and results of operations.
In response to guidance from the Centers for Disease Control and Prevention (“CDC”), we have implemented enhanced
measures at our authentication and grading facility in California to protect the health and safety of our employees, customers
and the communities in which we operate, which included shifting certain of our administrative and clerical personnel to a remote
work environment and reconfiguring our authentication and grading facility to enable social distancing. Notwithstanding our adoption
of CDC-recommended guidelines and preventative efforts to ensure the health and safety of our employees, it is possible that our
employees may contract COVID-19 while at our facilities, which could subject us to litigation.
We
are experiencing some inefficiencies in our operations as a result of our administrative and clerical personnel transitioning
to remote operations and the changes we have made to the work schedules of our employees working at our California authentication
and grading facility in order to accommodate social distancing. Our business operations also may be disrupted in the future if
the duration of the COVID-19 pandemic is prolonged, the severity of the pandemic increases or there is a second wave of COVID-19
infections in our community and, as a result, could lead to more COVID-19 infections among our authentication and grading employees.
In any such event, we could experience a decrease in the numbers of collectibles that we are able to authenticate and grade and
therefore, it would become difficult to meet the turnaround times requested by our customers. Also, our operations could be adversely
affected by travel restrictions (in addition to those that have been imposed by the Chinese government) or by other government
actions designed to slow the spread of COVID-19 in California.
As
a result, there is no assurance that our operations will not be disrupted once again if, for example, the duration of the COVID-19
pandemic becomes prolonged, or the severity of the pandemic worsens , or a substantial number of our onsite employees contract
COVID-19 at or about the same time. As a result, it could become necessary for us, in the future, to suspend our on-site authentication
and grading operations, which could have a material adverse effect on our results of operations and financial condition. See MANAGEMENT’S
DISCUSSION AND ANALYSIS OF FINANCIAL CONDITION AND RESULTS OF OPERATIONS—“Recent Developments: Coronavirus (COVID-19)”
in Item 7 below.
In
addition, the demand for our services, as well as our results of operations, could be adversely impacted due to a number of other
factors, including the following:
| ● | reduced customer demand for our services as customers seek to reduce or delay spending in response to the impacts of COVID-19, including from the recent rise in unemployment rates, decreased discretionary spending, and diminished consumer confidence; |
|
| ● | a deterioration in our ability to operate in affected domestic and international geographic regions, including a complete or partial closure of, or other operational issues at, our authentication and grading facilities, which could be further exacerbated by government restrictions and changes in consumer behavior; |
|
| ● | the cancellation or postponement of trade shows, at which we offer same day authentication and grading services and meet with current and new prospective customers; |
|
| ● | a decline in the number of modern coin programs conducted by the U.S. Mint, which could adversely impact our revenues from the authentication and grading of modern coins; |
The
full extent to which the COVID-19 pandemic impacts our business, results of operations and financial condition is highly uncertain
and subject to change, and will depend on a number of factors beyond our control, including, without limitation, the scope and
duration of the pandemic, actions taken by governmental authorities in response to the pandemic, the impact of the pandemic on
our customers and the communities in which we operate, the extent and duration of any economic recessionary conditions, and the
impact on the financial markets and our access to capital. We expect any further spread of the disease, including the potential
for a second wave of COVID-19 cases, or even the threat or perception that this could occur, or any protracted duration of decreased
economic activity, could have a material adverse impact on our business, results of operations and financial condition. See Recent
Developments: Coronavirus (COVID-19) under Item 7, MANAGEMENT’S DISCUSSION AND ANALYSIS
OF FINANCIAL CONDITION AND RESULTS OF OPERATIONS, in Part II of this Annual Report.
A
decline in the popularity of collectibles and a resulting decrease in submissions for our services could adversely impact our
business.
The
volume of collectibles submitted to us for authentication and grading is affected by the demand for and market value of those
collectibles and the popularity of certain coins released by the United States Mint. As the demand for and value of collectibles
increase, authentication and grading submissions, as well as requests by submitters for higher priced faster turnaround times,
can also increase. However, that also means that a decline in the popularity or, in the value of the collectibles that we authenticate
and grade would cause decreases in authentication and grading submissions to us and in fewer requests for faster turnaround times,
resulting in declines in our revenues and profitability. We have found, over the years, as evidenced by the reduction in our U.S.
coin grading fees in certain periods of fiscal years 2012 to 2013, 2015 to 2016, and fiscal 2018, that the popularity of collectibles
for certain specific coin programs, can vary due to a number of factors, most of which are outside of our control, including perceived
scarcity or lack of scarcity of collectibles, changes in consumer confidence and trends and their impact on disposable income,
precious metals prices, interest rates and other general economic conditions. See “Management’s Discussion and Analysis
of Financial Condition and Results of Operations-Factors that can Affect our Operating Results and Financial Position”
under Item 7 in this Annual Report.
We
are dependent on our coins and trading cards and autographs authentication and grading services for most of our revenues which
makes us vulnerable to changes in economic or market conditions that could adversely affect the demand for those services and
our operating results.
Coin
authentication and grading and other coin-related services accounted for approximately 53%, 57% and 63% of total net revenues
in fiscal 2020, 2019 and 2018, respectively. Our U.S. and overseas modern coin authentication and grading revenues represented
approximately 15%, 15% and 21% of our total revenues in fiscal 2020, 2019 and 2018, respectively. We believe that the principal
factors that can lead to fluctuations in U.S. coin grading submissions include:(i) economic downturns which could result in a
decline in consumer and business confidence and disposable income and, therefore, the willingness of dealers and collectors to
buy collectible coins, (ii) the performance of the stock and bond markets, the level of interest rates and fluctuations in the
value of the U.S. dollar and precious metals, which can lead investors to shift some of their investments between stocks and bonds,
on the one hand, and precious metals, on the other; (iii) in the case of modern coin submissions, increases or reductions in the
marketing activities or the popularity of programs that are conducted by the U.S. Mint or by dealers or customers, who specialize
in selling modern coins (iv) the pricing of our services particularly for our modern coin programs and (v) short-term changes
in the value of gold, particularly around the time of collectibles trade shows. In addition, our cards and autographs revenues
accounted for approximately 43%, 36% and 31% of our total net revenues in fiscal 2020, 2019, 2018 respectively, and that business
has continued to grow consistently over a number of years, such that our dependence on that business has increased. This continuing
lack of diversity in our sources of revenues and our dependence on submissions from our two main businesses for a majority of
our net revenues make us more vulnerable to changes in market conditions, which could result in reductions in our total net revenues
and gross margin and, therefore, hurt our operating results, as evidenced by the reduction in both our revenues and operating
income in fiscal 2018 as compared with fiscal 2017, due mainly to the lower U.S. coin revenues in fiscal 2018.
Moreover,
if the economic downturn resulting from COVID-19 becomes prolonged, demand for our authentication and grading services may decrease
and may negatively impact our results of operations and financial condition.
Increases
in turnaround times experienced by customers at our trading cards and autographs business may reduce demand for our services and
could reduce revenue growth or cause a decline in revenues.
Our
cards and autographs business which represents about 43% of total revenues in fiscal 2020, has experienced revenue growth rates
of 27% and 25% in fiscal 2020 and 2019, respectively. In addition, as of June 30, 2020, that business had a record backlog of
collectible submissions, awaiting authentication and grading by our experts. We continue to add authentication and grading capacity
to meet the increased demand for our services, however, our backlog has continued to grow in fiscal 2020. Although to date, we
have not experienced a slowdown in submissions from our customers, over time continued increased turnaround times may negatively
impact the level of submissions and therefore reduce the growth of our revenues.
Declines
in general economic conditions could result in decreased demand for our services, which could adversely affect our operating results.
The
availability of discretionary or disposable income and the confidence of collectors and dealers about future economic conditions
are important factors that can affect their willingness and ability to purchase, and the prices that they are willing to pay for
collectibles. Declines in customer confidence resulting from reductions in cash flows, and the availability of credit, could adversely
affect the ability of customers to purchase high-value collectibles and delay the sale of collectibles that may have declined
in value due to adverse economic conditions. Declines in purchases and sales, or in the value of collectibles usually result,
in turn, in declines in the use of authentication and grading services, as such services are often used in conjunction with and
to facilitate collectibles sale and purchase transactions. As a result, economic uncertainties, downturns and recessions can and
do adversely affect our operating results by (i) reducing the frequency with which collectibles dealers and collectors submit
their coins, trading cards and other collectibles for authentication and grading including, in particular, modern coins and trading
cards, primarily because authentication and grading fees are relatively high in relation to the value of those collectibles; and
(ii) adversely affecting the ability of customers to pay outstanding accounts receivable on a timely basis.
Temporary
popularity of some collectibles may result in short-term increases, followed by decreases, in the volume of submissions for our
services, which could cause our revenues to fluctuate.
Temporary
popularity or “fads” among collectors, or the popularity of certain modern coin marketing programs, either by the
U.S. Mint or by dealers or distributors of collectibles, may lead to short-term or temporary increases, followed by decreases
in the volume and in the average service fees that can be generated on collectibles that we authenticate and grade. This can be
particularly common with modern coins released by the U.S. Mint or other special releases that are seasonal in nature or have
a concentration of demand around the coin release dates but limited follow-on demand. Trends of this nature may result in significant
period-to-period fluctuations in our operating results and could result in declines in our net revenues and profitability, not
only because of a resulting decline in the volume of authenticating and grading submissions, but also because such trends could
lead to increased price competition, or pressure on the fees we are able to charge customers, which could require us to reduce
our authentication and grading fees in order to maintain market share.
Our
top five customers account for approximately 10% of our total net revenues in fiscal 2020
During
the year ended June 30, 2020, five of our customers accounted, in the aggregate, for approximately 10% of our total net revenues.
As a result, the loss of any of those customers, or the lack of success of marketing programs by those customers both in the U.S.
or in China, or changes in our relationship with any of those customers could lead to a decrease in the volume of grading submissions
which could cause our net revenues to decline and, therefore, could harm our operating results. See “Management’s
Discussion and Analysis of Financial Condition and Results of Operations-Factors that can Affect our Operating Results and
Financial Position” below in the Report.
There
are risks associated with new or expanded service offerings and geographic expansion, with which we have limited experience.
On
an ongoing basis, we seek to introduce new services that we can offer to our existing authentication and grading customers as
a means of increasing our net revenues and profitability. In addition, in recent years we began offering and providing authentication
and grading services in China, Hong Kong, France and Japan. Those new services and our international operations, however, may
not meet our expectations and may prove to be unprofitable which could lead to impairments of amounts capitalized and negatively
impact our operating results. Furthermore, volatility in the level of services generated at our international operations, particularly
in China, may add volatility to our quarterly and annual operating results.
Changing
market conditions in China have adversely affected the level of China revenues and the future growth of our coin business in China
may be slower in the future.
The
reduction in China revenues to $4.2 million in fiscal 2019, from $7.7 million in fiscal 2018, reflects the absence of any significant
revenues from the banking channel in China. As previously reported, through February 2018, we had an exclusive relationship with
a banking channel customer in China. Due to changing market conditions in China, and a desire to broaden our customer base, in
February 2018, we notified the customer that we had decided to terminate the exclusive relationship. As a result we have not generated
any significant revenues from that customer since then. It is difficult to predict the longer-term effect this action will have
on future coin submissions from this customer or how successful we will be in attracting submissions from other coin customers
in China. However, non-banking channel revenues increased by approximately 24% and 14% in fiscal 2020 and 2019, respectively.
See also “Management’s Discussion and Analysis of Financial Condition and Results of Operations—Factors that
can Affect our Operating Results and Financial Position” under Item 7.
Our
business is subject to risks associated with doing business outside the United States.
We
have expanded our coin authentication and grading businesses into foreign markets including China, Hong Kong, France and Japan.
Those operations pose risks that might adversely affect, possibly materially, our future financial performance. Those risks include
the following:
| ● | potential difficulties in complying with multiple and potentially conflicting laws and regulations, which could increase our costs of doing business internationally and could expose us to possible governmental or legal action in the foreign countries where we conduct business; |
|
| ● | difficulties in navigating the evolving exchange control regulations in China that can cause delays in repatriating excess cash balances from China to the United States. |
|
| ● | difficulties in staffing and managing international operations; |
|
| ● | differences in and difficulties in enforcing intellectual property protections; |
|
| ● | potentially adverse tax consequences due to overlapping or differing tax structures; |
|
| ● | fluctuations in currency exchange rates; |
|
| ● | risks associated with operating a business in a potentially unstable political climate, such as (for example) the recent political instability and uncertainty in Hong Kong; |
|
| ● | potential difficulties in identifying and responding to changes in market conditions in overseas markets; and |
|
| ● | possible adverse effects of trade disputes between the United States and foreign countries, such as China, where we conduct business. |
We
invoice our overseas customers for our coin authentication and grading services in the local foreign currency in the country in
which the business operates, except in the case of Hong Kong, where we invoice our customers in U.S. dollars. In fiscal 2020,
the impact of fluctuations in foreign currencies on our financial results was not significant. There is, however, no assurance
that there will not be changes in foreign exchange rates that would have a material adverse effect on our results of operations
in the future.
We
are dependent on our key management personnel.
Our
performance is greatly dependent on the performance of our senior management and certain other key employees. As a result, the
loss of the services of any of our executive officers or other key management employees could harm our business. Some of our executive
officers and key employees are experts in the collectibles markets and have industry-wide reputations for authentication and grading
of collectibles. The loss of any of those officers or other key employees, could have a negative effect on our reputation for
expertise in the collectibles markets that we serve, which could lead to a reduction in authentication and grading submissions
to us and thereby result in decreases in revenues and profitability.
We
are dependent on our collectibles experts.
In
each of our markets, there are a limited number of individuals who have the expertise to authenticate and grade collectibles,
and competition for available collectibles experts is intense. Accordingly, our business and our growth initiatives are heavily
dependent on our ability (i) to retain our existing collectibles experts, who have developed relatively unique skills and enjoy
a reputation for being experts within the collectibles markets, and (ii) to implement personnel programs to enable us to add collectibles
experts, as necessary, to grow our business, both in the United States and overseas and to offset employee turnover that can occur
from time to time. Moreover, some of our experts could leave and, in the past, have left our Company to join competitors or start
competing businesses. If we are not successful in retaining our existing collectibles experts or in hiring and training new collectibles
experts, particularly in our cards and autographs business, which has experienced significant increased demand in recent years,
this could limit our ability to grow our business and adversely affect our operating results and financial condition.
Damage
to our reputation could have a material adverse effect on our business, financial condition and results of operations.
We
have developed a reputation as one of the leading third party providers of collectibles authentication and grading services, as
a result of a number of factors including, we believe, the rigorousness and consistency of our grading standards, the integrity
of our grading processes and related warranty protection to our customers, our knowledge of the collectibles markets in which
we operate, and innovative programs and services that we have developed and are able to offer to our customers, including the
Collectors Club, our Set Registry Programs and our Certified Coin Exchange dealer-to-dealer Internet bid-ask market. As a result,
our continued success is heavily dependent on our maintaining that reputation among collectibles dealers and collectors. Failures
or errors in authentication or grading processes, such as inconsistent application of grading standards or incidents that put
the integrity of those processes into question, could significantly impair our reputation in the marketplace which, in turn, could
lead to a loss of customer confidence and a decrease in the demand for our services and, therefore, could have a material adverse
effect on our business, financial condition and results of operations.
We
could suffer losses on authentication and grading warranties.
In
general, we issue an authenticity or grading warranty for coins and trading cards that we authenticate or grade. Those warranties
provide that:
| ● | if a coin or trading card that we authenticated and sealed in one of our tamper-evident plastic holders are later determined by us not to have been genuine, we would have to purchase the collectible at its current market value had it been genuine; or |
|
| ● | if a coin or trading card that we graded and sealed in one of our tamper-evident plastic holders later receives a lower grade upon resubmission to us for grading, we would be obligated either to purchase the collectible at the market value at its original assigned grade or to pay the difference between that value as compared to the value at the lower grade. |
We
have no insurance coverage for claims made under these warranties. We monitor the adequacy of our warranty reserves on an ongoing
basis and maintain reserves for warranty claims based on historical experience. However, there is no assurance that these warranty
reserves will prove to be adequate, and as we expand our services in overseas markets, we may incur higher warranty claims than
we have experienced in the past. If our warranty reserves prove to be inadequate, our gross margin and operating results could
be harmed.
Increased
competition could adversely affect our financial performance.
Although
there are few major competitors in the collectibles authentication and grading markets in which we currently operate, competition
in these markets is, nevertheless, intense. Increased competition in our collectibles markets could adversely affect our pricing
and profit margins and our ability to achieve further growth, and we cannot provide assurances that we will continue to be successful
in competing against existing or future competitors in our collectibles markets. Also, if we were to enter into new collectibles
markets, it is likely we would face intense competition from existing competitors in those markets who are likely to have greater
brand name recognition and long-term relationships with collectibles dealers and individual collectors in those markets than we
will have. Such competition could adversely affect our ability to generate profits and could cause us to incur losses or impairment
charges in those markets and damage our financial condition.
There
is no assurance that we will continue to pay cash dividends at current levels or at all.
As
previously reported, the continued payment of cash dividends is subject to a number of factors, including changes in market and
financial conditions and the cash requirements of our business. On February 4, 2018 the Board of Directors approved a reduction
in the amount of quarterly cash dividends to $0.175 per share from $0.35 per share. Although, we consider the new dividend policy
to be at a more sustainable level, there is no assurance that the amount of the current quarterly cash dividend will not be further
reduced or the payment of cash dividends will not be suspended or discontinued altogether by the Board of Directors, if e.g. the
prolonged effects of COVID-19 were to decrease the demand for our services. See Market for Common Stock, Related Stockholder Matters
and Issuer Purchases of Equity Securities ─ Dividends in Part II, Item 5 of this Annual Report. Any further reduction
in the amount of, or any suspension or discontinuation of, our quarterly cash dividend is likely to adversely affect our stock
price.
Our
reliance on a limited number of suppliers for principally all of our “tamper-evident,” clear plastic coin and trading
card holders exposes us to potential supply and quality problems.
We
place all of the coins and trading cards that we authenticate and grade, in tamper-evident, clear plastic holders and related
gaskets. In addition, we incorporate security features into the holders to mitigate the risk of counterfeits. In order to
take advantage of volume-pricing discounts, we purchase substantially all of those holders, from a limited number of
suppliers. For our highest volume most critical plastic parts, we now have back-up suppliers and dies used in the manufacture
of those parts. However, some of our back-up suppliers for these plastic holders are not U.S. based suppliers. In addition,
when developing new holders, we concentrate the purchase of holders through a single supplier, at least initially. Our
reliance on a limited number of suppliers for a substantial portion of those plastic holders could expose us to the potential
for delays in our ability to deliver timely authentication and grading services in the event that a supplier was to terminate
its services to us or encounter financial or production problems. If, in such an event, we were unable to obtain replacement
holders from a back-up supplier in a relatively short period of time, we could lose customer orders, or incur additional
production costs, or both. To mitigate this risk, the Company (i) owns the dies used to manufacture the parts and (ii) has
increased its inventory of holders to give us more time to arrange for production from other suppliers in the event of a
termination of or interruption in service from our existing suppliers. If holders obtained from alternative suppliers are not
of consistent quality, we could be exposed to additional warranty claims because tampering with those holders may not be as
readily detectible. In addition, using overseas suppliers for holders may expose us to a higher risk of counterfeit holders
that could damage our reputation. These factors could cause a decline in our net revenues and increases in our costs of sales
which could have a material adverse effect on our results of operations.
Uncertainties
in the interpretation and application of the 2017 Tax Cuts and Jobs Act and tax laws, in general, could materially affect our
tax obligations and effective tax rate.
The
2017 Tax Cuts and Jobs Act (the “Tax Act”) was enacted on December 22, 2017, and significantly affected U.S. tax law
by changing the rate and how the U.S. imposes income tax on U.S. and multinational corporations. The U.S. Department of Treasury
has broad authority to issue regulations and interpretative guidance that may significantly impact how we will be able to apply
the law which could impact our tax obligations in the period issued.
In
addition, tax laws can require complex computations, the application of which, can be uncertain. Furthermore, a rollback of the
reduced rates in the Tax Act, could materially affect our tax obligations and effective tax rates, in the future.
Our
computer systems and network systems may be vulnerable to system failure due to a lack of redundant systems at other locations.
Our
operations are dependent on our ability to protect our computer systems against damage from fire, power loss, telecommunications
failure, fires, earthquakes and similar catastrophic events. In this regard, Southern California, where we are located and our
computer systems are housed, is particularly vulnerable to earthquakes and fires that could result in damage to our computer systems
which, in turn, could cause interruptions of our services. Additionally, we could encounter disruptions that would harm our business
as a result of problems on the internet or actions of internet users that could make it difficult for our customers to access
our websites. Difficulties encountered during planned system upgrades or re-implementations also could lead to disruptions of
our services.
While
we have standby redundancy for most of our computer systems in the cloud, not all systems are being replicated in real time. As
a result, if any such events, disruptions or other of these problems were to occur, we could become unable to access information
that is critically important to our ability to continue our operations which could cause interruptions in the delivery of our
services and harm our business, operating results and financial condition.
Our
business is subject to online security risks, including security breaches.
In
the ordinary course of our business, we receive, and store confidential personally identifiable information provided to us by
our customers, such as passwords and credit card information.
An
increasing number of large internet companies and traditional “brick and mortar” businesses have disclosed security
breaches of their websites and computer systems that have led to the interruptions of service and, in certain cases, the misappropriation
or theft of confidential personally identifiable information of their customers (often referred to as “identity theft”).
Because the techniques used by the perpetrators of such security breaches change frequently and may be difficult to detect, like
those companies and businesses, we may be unable to anticipate the techniques used in such breaches or to implement adequate preventative
measures. Data security breaches may also result from non-technical causes such as, for example, actions of employees or third
party service providers. Our servers also are vulnerable to computer viruses or malware and physical or electronic break-ins that
could prevent our customers from accessing our online services. In addition, our internal systems could be subjected to ransomware
attacks, that would enable hackers to take control of our systems and then demand payments to release those systems or threaten
to disclose proprietary information about the Company, if ransoms are not paid. Furthermore, hardware that we procure from third
parties may contain defects in design or other problems that could unexpectedly compromise information security or disrupt our
operations. We rely on encryption and authentication technology licensed from third parties to provide for secure storage and
transmissions of confidential information, including customer passwords and payment card numbers and we back-up our systems and
data on a regular basis. However, as the recent disclosures by large internet companies and traditional businesses demonstrate,
such technology may not be sufficient to enable us to detect or prevent security breaches or the misappropriation or theft of
customer or proprietary information, which could damage our reputation and lead customers to discontinue their use of our services.
In
addition, security breaches could result in a violation of privacy and other applicable laws, thereby exposing us to potentially
significant legal or financial exposure to government (including overseas governments) actions and private litigation. Governmental
agencies (both domestic and foreign) investigating any such breaches may seek to impose fines or other monetary penalties on us
or to seek injunctive relief that could materially increase our data security costs and adversely impact our operations.
We
rely on third parties for various Internet and processing services.
Our
operations depend on a number of third parties for Internet access and delivery services. We have limited control over these third
parties and no long-term relationships with any of them. For example, we do not own a gateway onto the Internet, but, instead,
rely on Internet service providers to connect our website to the Internet. Should the third parties that we rely on for Internet
access or delivery services become unable to serve our needs for a sustained time period whether as a result of a strike, or a
natural disaster or for any other reason, our revenues and business could be harmed.
Acquisitions,
the commencement of new businesses and expansion into overseas markets, present risks, and we may be unable to achieve our financial
and strategic goals related to those activities.
There
may be opportunities that present themselves to acquire existing businesses, commence new businesses or expand our markets through
foreign expansion that would give us the opportunity to increase our revenues and our earnings. The purchase or commencement of
a new business , or the expansion of our overseas businesses, however, present a number of risks and uncertainties, including
(i) difficulties in integrating a new business or a new location into our existing operations, as a result of which we may incur
increased operating costs that can adversely affect our operating results; (ii) the risk that our current and planned facilities,
computer systems and personnel and controls will not be adequate to support our expanded operations; (iii) the diversion of management
time and capital resources from our existing businesses, which could adversely affect the performance of those businesses and
our operating results; (iv) dependence on key management personnel of an acquired or newly started businesses or at the new geographic
locations and the risk that we will be unable to integrate or retain such personnel; and (v) the risk that the anticipated benefits
of any acquisition or of the commencement of any new business or overseas operations may not be realized or changes we make to
an acquired business may harm the performance of that business, in which event we will not be able to achieve an acceptable return
and we may incur losses on those investments.
The
Company is subject to litigation risks that can make the timing of expense recognition uncertain and can have a material adverse
effect on our results of operations and financial condition.
From
time to time, the Company is involved as a defendant in lawsuits that arise in the ordinary course of business. In certain instances,
the Company may have insurance coverage that can help mitigate costs and losses that can arise in such a dispute, subject to retentions
that apply to the related insurance policy. As litigation progresses, new or changed information can change the Company’s
evaluation of the outcome of a lawsuit, which can give rise to a change in the amount of expense accruals for such disputes. In
addition, insurance coverage can be complex and uncertain, especially when only some of the alleged acts that give rise to the
dispute are covered under the insurance policy or when a dispute spans more than one coverage period, with different insurance
carriers providing coverage. Furthermore, insurance carriers may have a different view than management on the potential outcome
of a dispute and can apply pressure on management to resolve a lawsuit, when the Company has worked through the retention that
applies to an insurance policy. The Company evaluates its position on lawsuits on a quarterly basis and records accruals in accordance
with U.S. GAAP. The outcomes of individual lawsuits and disputes, if material, could adversely affect our results of operations
and financial condition.
We
depend on our ability to protect and enforce our intellectual property rights.
We
believe that our trademarks and other proprietary rights are important to our success and competitive position. We rely on a combination
of patents, trademarks, copyright and trade secret laws to establish and protect our proprietary rights. However, the actions
we take to establish and protect our intellectual and other proprietary rights may prove to be inadequate to prevent imitation
of our services or products, especially in international markets, or to prevent others from claiming violations of their intellectual
and proprietary rights by us. In addition, others may develop similar trade secrets or other intellectual property independently
or assert rights in our intellectual and other proprietary rights that could lead them to seek to block sales of our services
based on allegations that use of some of our marks or other intellectual property constitutes a violation of their intellectual
property rights.
Our
unregistered trademarks could conflict with trademarks of others.
We
have not conducted an exhaustive search of possible prior users of our unregistered trademarks or service marks. Therefore, it
is possible that our use of some of these trademarks or service marks may conflict with the rights of others. As a result, we
could face litigation or incur liabilities for infringing the intellectual rights of others or lose the use of some of these trademarks
or service marks, all of which could have an adverse effect on our name recognition and result in a decrease in our revenues and
an increase in our expenses.
The
imposition of government regulations could increase our costs of doing business.
With
the exception of state laws applicable to autograph authentication, the collectible coin and other high-value collectibles markets
are not currently subject to direct federal, state, local or overseas regulation. However, from time to time government authorities
discuss additional regulations which could impose restrictions on the collectibles industry, such as regulating collectibles as
securities or requiring collectibles dealers to meet registration or reporting requirements or regulating the conduct of collectibles
auction businesses. Adoption of laws or regulations of this nature could lead to a decline in sales and purchases of collectibles
and, therefore, also to a decline in the volume of coins, trading cards and other collectibles that are submitted to us for authentication
and grading.
If
we are found to have violated laws concerning the privacy and security of consumers’ or other individuals’ personal
information, we could be subject to civil or criminal penalties, which could increase our liabilities and harm our reputation
and, therefore, our business.
There
are a number of domestic and international laws protecting the privacy and security of personal information. These laws include
U.S. state laws, such as the California Consumer Privacy Act (CCPA), which took effect on January 1, 2020, as well as the European
Union’s General Data Protection Regulation (GDPR), E.U.-member state laws, or similar applicable laws. These laws may place
limits or conditions on how we collect, use, and share personal information, and they may impose obligations to protect that information
against unauthorized access, use, loss, and disclosure. If we, or any of our service providers who have access to the personal
data for which we are responsible, are found to be in violation of the privacy or security requirements of applicable data protection
laws, we could be subject to civil or criminal penalties, which could increase our liabilities, harm our reputation and have a
material adverse effect on our business, financial condition and operating results. Although we utilize a variety of measures
to comply with applicable obligations and secure the data that we process, even compliant entities can experience security breaches
or have inadvertent failures despite employing reasonable practices and safeguards. We may also face new risks relating to data
privacy and security as the United States, individual U.S. states, E.U. member states, and other international jurisdictions adopt
or implement new data privacy and security laws and regulations as we continue to commercialize our services worldwide. Our business
may need to adapt to the extent any such new laws place new or additional obligations on us.
The
market for our shares is limited, which may adversely affect the trading value and liquidity of our common stock.
The
trading volume of our shares is relatively low, at a daily average of approximately 97,000 shares during the 90 trading days ended
July 7, 2020, which reduces the liquidity of our shares, making it more difficult for our stockholders to sell their shares if
the need to do so arises. The low trading volumes also may depress, and make it more difficult to achieve increases in, the trading
prices of our shares.
If
our quarterly results are below market expectations, the price of our common stock may decline.
Many
factors, including those described in this “Risk Factors” section, can affect our business, financial condition and
results of operations, which makes the prediction of our future financial results difficult and uncertain. These factors include:
| ● | period to period, including quarterly increases or decreases in the numbers and mix of collectibles graded between coins and trading cards and autographs, including the volume of modern coin programs (domestically and/or overseas); |
|
| ● | changes in and the seasonality of the coin markets in the United States and China; |
|
| ● | changes in market conditions that can affect the demand for our authentication and grading services, such as a decline in the popularity of certain collectibles and volatility in the prices of gold and other precious metals, or the existence, popularity or the absence of U.S. Mint programs or continued economic fallout from COVID-19; |
|
| ● | changes in economic conditions that reduce the availability of disposable income or that may cause collectors and collectibles dealers to reduce their purchases of collectibles, which could result in declines in the demand for the services we provide; and |
|
| ● | the actions of our competitors. |
Although,
we do not provide guidance on future operating results, if, as a result of these or other conditions or factors, our quarterly
operating results fall below market expectations, some of our stockholders may sell their shares, which could adversely affect
the trading prices of our common stock. Additionally, in the past, companies that have experienced declines in the trading prices
of their shares due to events of this nature have been the subject of securities class action litigation. If we become involved
in a securities class action litigation in the future, it could result in substantial costs and diversion of our management’s
attention and resources, thus harming our business.
As
a result of changes in SEC rules, we have ceased to be an accelerated filer and have become a “smaller reporting company”
under the SEC’s disclosure regime. Consequently, our disclosure requirements for this Annual Report are, in certain respects,
less stringent than in prior fiscal years when we were an accelerated filer.
As
a smaller reporting company under the SEC’s disclosure regime, our disclosure requirements are now less stringent than in
previous years when we were an accelerated filer. However, we have decided not to take advantage of many of the lessened disclosure
requirements that would have otherwise permitted us, for example, to exclude the sections contained in this Annual Report entitled
“Selected Consolidated Financial Data” and “Management’s Discussion of Financial Condition and Results
of Operations” and, for that reason, those sections are included below in this Annual Report. We have decided not to include,
in this Annual Report, an attestation report of our registered public accounting firm regarding internal control over financial
reporting.
Provisions
in our charter documents or in Delaware law may make an acquisition of us more difficult or delay a change in control, which may
adversely affect the market price of our common stock.
Our
Amended and Restated Certificate of Incorporation and Bylaws contain anti-takeover provisions, including those listed below, that
could make it more difficult for a third party to acquire control of us, even if that change of control would be beneficial to
our stockholders:
| ● | our Board of Directors has the authority to issue additional common stock and preferred stock and to determine the price, rights and preferences of any new series of preferred stock without stockholder approval; |
|
| ● | there are limitations on who can call special meetings of our stockholders; |
|
| ● | stockholders may not take action by written consent; and |
|
| ● | Provisions of Delaware law and provisions of our stock incentive plans and some of our employment contracts may also discourage, delay or prevent a change in control or unsolicited acquisition proposals. |
| ITEM 1B. |
UNRESOLVED STAFF COMMENTS |
None
On
February 3, 2017, the Company, as tenant, entered into an office lease, pursuant to which the Company is leasing approximately
62,755 rentable square feet space for its headquarters office and principal business operations. Under the terms of the lease,
the Company is responsible for its share of real estate taxes, building insurance and maintenance costs (“triple net”).
The term of this lease was for 10 years and 10 months, which commenced on the completion of tenant improvements, which was December
1, 2017. The Company received an abatement of the monthly rent for the period from January 1, 2018 through October 31, 2018. The
landlord contributed approximately $2.9 million to the tenant improvements. At June 30, 2020, aggregate minimum obligation over
the remaining term of the lease was approximately $12.0 million.
We
also leased smaller facilities for our overseas operations including a five year lease for our Shanghai office that commenced
in November 2017, with aggregate minimum obligations over the term of the lease of approximately $3.0 million and a three year
lease for our Hong Kong office that commenced in July 2018 with aggregate minimum obligations over the term of the lease of approximately
$625,000.
We
are named from time to time as a defendant in lawsuits that arise in the ordinary course of business.
We
establish accruals for lawsuits or disputes when it is determined that a loss is both probable and can be reasonably estimated.
Accruals can be adjusted from time to time, in light of additional or changed information or based on a re-assessment of the risks
and costs of proceeding with lawsuits and disputes. We do not believe that any of such lawsuits that are currently pending are
likely to have a material adverse effect on our business, financial condition or results of operations.
| ITEM 4. |
MINE SAFETY DISCLOSURES |
Not
Applicable
EXECUTIVE
OFFICERS OF REGISTRANT
| Name | Age | Positions | ||
| Joseph J. Orlando |
48 | President and Chief Executive Officer |
||
| Joseph J. Wallace |
60 | Senior Vice President and Chief Financial Officer |
JOSEPH
J. ORLANDO was appointed as the Company’s Chief Executive Officer effective October 9, 2017. Mr. Orlando joined the
Company in 1999 and in 2002 was promoted to the position of President of Professional Sports Authenticators, the Company’s
sports trading card authentication and grading division. In 2003, he was also appointed as President of PSA/DNA, the Company’s
autograph and memorabilia authentication division. Mr. Orlando has an extensive knowledge of the collectibles markets, which will
be valuable in evaluating the Company’s strategic initiatives in, those markets. Mr. Orlando has earned both a Bachelor’s
Degree and a Law Degree.
JOSEPH
J. WALLACE became the Company’s Chief Financial Officer in September 2005. Prior to becoming Chief Financial Officer,
he was the Company’s Vice President of Finance from November 2004 and Controller from June 2004. From 1997 to 2003, Mr.
Wallace was Vice President of Finance, Chief Financial Officer and Secretary of STM Wireless, Inc., a publicly traded company
engaged in the business of developing, manufacturing and marketing satellite communications products and services. Mr. Wallace
is a Fellow of the Institute of Chartered Accountants in Ireland, and a CPA in the State of California.
| ITEM 5. |
MARKET FOR COMMON STOCK, RELATED STOCKHOLDER MATTERS AND ISSUER PURCHASES OF EQUITY SECURITIES |
Our
common stock is listed on the NASDAQ Global Market, trading under the symbol CLCT. The following tables set forth the high and
low closing prices of our common stock, as reported by NASDAQ, and the cash dividends per share that we paid to our stockholders,
in each of the fiscal quarters in the fiscal years ended June 30, 2020 and 2019:
|
Closing |
Cash Dividend |
|||||||||||
| Fiscal 2020 |
High | Low | Per Share |
|||||||||
| First Quarter |
$ | 29.47 | $ | 21.75 | $ | 0.175 | ||||||
| Second Quarter | 29.82 | 22.88 | 0.175 | |||||||||
| Third Quarter | 28.50 | 15.08 | 0.175 | |||||||||
| Fourth Quarter | 35.61 | 14.66 | 0.175 | |||||||||
|
Closing |
Cash Dividend |
|||||||||||
| Fiscal 2019 |
High | Low | Per Share |
|||||||||
| First Quarter |
$ | 15.35 | $ | 13.15 | $ | 0.175 | ||||||
| Second Quarter | 14.89 | 10.17 | 0.175 | |||||||||
| Third Quarter | 17.76 | 11.49 | 0.175 | |||||||||
| Fourth Quarter | 22.20 | 17.21 | 0.175 | |||||||||
We
had approximately 93 holders of record and approximately 6,500 beneficial owners of our common stock as of June 30, 2020.
Dividends.
In February 2018, the Board of Directors reduced the Company’s quarterly cash dividend to $0.175, for an annual dividend
of $0.70 per share. The previous dividend policy was $0.35 per share per quarter and was in effect for the period January 2015
to January 2018. Dividends paid to our stockholders in fiscal 2020, 2019 and 2018 totaled $6.3 million, $6.5 million, and $9.1
million, respectively.
The
declaration and payment of cash dividends in the future, pursuant to the Company’s dividend policy, is subject to final
determination each quarter by the Board of Directors based on a number of factors, including the Company’s financial performance
and its available cash resources, its cash requirements and alternative uses of cash that the Board may conclude would represent
an opportunity to generate a greater return on investment for the Company and its stockholders. Accordingly, there is no assurance
that, in the future, the amount of the quarterly cash dividend will not be reduced or that the payment of dividends will not be
suspended or altogether discontinued.
STOCK
PERFORMANCE GRAPH
Set
forth below is a graph which compares, for each of the years in the five year period ended June 30, 2020, the cumulative total
returns for the Company and for (i) the companies included in the Russell 2000 Index, of which the Company is a member, and (ii)
an index of fifteen companies that we selected (the “New Peer Group”) and (iii) an index of ten companies that we
selected for inclusion in our fiscal 2019 10-K (the “Prior Year Peer Group”).
The
companies comprising the New Peer Group and their respective trading symbols are: Asure Software Inc. (“ASUR”), Cass
Information Systems Inc. (“CASS”), Century Casinos, Inc. (“CNTY”), ChannelAdvisor Corporation (“ECOM”),
eGain Corporation (“EGAN”), Franchise Group, Inc. (“FRG”), Franklin Covey, Co. (“FC”), Hemisphere
Media Group, Inc. (“HMTV”), Majesco (“MJCO”), OneSpan, Inc. (“OSPN”), Saga Communications,
Inc. (“SGA”), Techtarget Inc. (“TTGT”), The Meet Group, Inc. (“MEET”), Travelzoo (“TZOO”)
and Value Line, Inc. (“VALU”).
The
companies that comprised the Prior Year Peer Group and their respective trading symbols are: Apex Global Brands (“APEX”),
Cass Information Systems Inc. (“CASS”), Daily Journal Corp. (“DJCO”), Forward Industries Inc. (“FORD”),
Innodata Inc. (“INOD”), Lakeland Industries Inc. (“LAKE”), PRGX Global Inc. (“PRGX”), Sequential
Brands Group Inc. (“SQBG”), Techtarget Inc. (“TTGT”) and, Value Line Inc. (“VALU”).
We
utilized the services of a third party consulting firm to assist us in the selecting of companies comprising the New Peer Group.
We believe that those companies are more comparable to Collectors Universe in terms of revenue, market capitalization and industry
than the companies that made up the Prior Year Peer Group.
The
selection of Peer Group companies presented a challenge for us, because of the relative uniqueness of our business, which consists
primarily of providing authentication, grading and information services to collectibles dealers and to individuals, who collect
and buy and sell coins and cards/autographs.
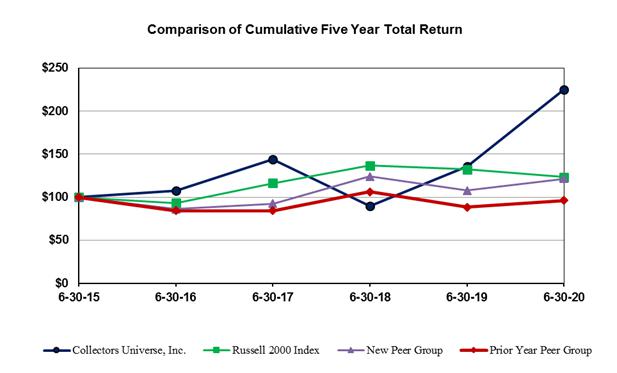
| At June 30, |
||||||||||||||||||||||||
| 2015 | 2016 | 2017 | 2018 | 2019 | 2020 | |||||||||||||||||||
| Collectors Universe, Inc. |
100.00 | 107.39 | 143.86 | 89.68 | 135.87 | 224.69 | ||||||||||||||||||
| Russell 2000 Index | 100.00 | 93.27 | 116.21 | 136.63 | 132.11 | 123.35 | ||||||||||||||||||
| New Peer Group | 100.00 | 86.07 | 92.34 | 123.88 | 107.62 | 121.37 | ||||||||||||||||||
| Prior Year Peer Group | 100.00 | 84.24 | 84.10 | 106.09 | 88.37 | 96.27 | ||||||||||||||||||
Copyright©
2020 Russell Investment Group. All rights reserved.
This
Stock Performance Graph assumes that $100 was invested, on June 30, 2015, in the Company’s shares, the Russell 2000 Index
and in the shares of the companies in the New Peer Group and Prior Year Peer Group, respectively, and that any dividends paid
for the indicated periods were reinvested. Stockholder returns shown in the Stock Performance Graph are not necessarily indicative
of future stock performance.
This
above performance graph shall not be deemed “soliciting material” or to be “filed” with the Securities
and Exchange Commission for purposes of Section 18 of the Securities Exchange Act of 1934, as amended, or otherwise subject to
the liabilities under that Section, and shall not be deemed to be incorporated by reference into any filing of Collectors Universe,
Inc. under that Act or the Securities Act of 1933, as amended.
| ITEM 6. |
SELECTED CONSOLIDATED FINANCIAL DATA |
The
selected operating data for the fiscal years ended June 30, 2020, 2019 and 2018, and the selected balance sheet data at June 30,
2020 and 2019 set forth below are derived from the Company’s audited consolidated financial statements included elsewhere
in this Annual Report. The other operating data and balance sheet data were derived from audited consolidated financial statements
that are not included in this Annual Report. The following selected consolidated data should be read in conjunction with our Consolidated
Financial Statements and the related notes thereto and with “Management’s Discussion and Analysis of Financial Condition
and Results of Operations” included below in this Annual Report.
The
results of our operations, as set forth in the table below, consist primarily of the results of operations of our collectible
coin, trading card, autographs and memorabilia authentication and grading businesses and to a lesser extent our Certified Coin
Exchange (“CCE”), Expos, Collectors.com and Coinflation.com businesses for each of the fiscal years in the five-year
period ended June 30, 2020.
Consolidated
Statements of Operations Data:
| Year Ended June 30, |
||||||||||||||||||||
| 2020 | 2019 | 2018 | 2017 | 2016 | ||||||||||||||||
| (In thousands, except per share data) |
||||||||||||||||||||
| Net revenues | $ | 78,891 | $ | 72,453 | $ | 68,449 | $ | 70,158 | $ | 60,954 | ||||||||||
| Cost of revenues | 33,655 | 30,153 | 29,471 | 26,847 | 22,902 | |||||||||||||||
| Gross profit | 45,236 | 42,300 | 38,978 | 43,311 | 38,052 | |||||||||||||||
| Selling, general and administrative expenses(i) |
30,648 | 27,958 | 30,001 | 30,087 | 25,682 | |||||||||||||||
| Impairment charge(ii) |
486 | – | – | – | – | |||||||||||||||
| Operating income | 14,102 | 14,342 | 8,977 | 13,224 | 12,370 | |||||||||||||||
| Interest income (expense), net | 78 | (69 | ) | (114 | ) | (1 | ) | 22 | ||||||||||||
| Other income (expense), net |
15 | (148 | ) | 29 | 11 | (73 | ) | |||||||||||||
| Income before provision for income taxes | 14,195 | 14,125 | 8,892 | 13,234 | 12,319 | |||||||||||||||
| Provision for income taxes |
3,409 | 4,148 | 2,760 | 4,718 | 4,720 | |||||||||||||||
| Income from continuing operations | 10,786 | 9,977 | 6,132 | 8,516 | 7,599 | |||||||||||||||
| Income (loss) from discontinued operations, (net of income taxes) |
– | – | 104 | (7 | ) | 41 | ||||||||||||||
| Net income |
$ | 10,786 | $ | 9,977 | $ | 6,236 | $ | 8,509 | $ | 7,640 | ||||||||||
| Net income per basic share: | ||||||||||||||||||||
| Income from continuing operations | $ | 1.20 | $ | 1.12 | $ | 0.71 | $ | 1.00 | $ | 0.90 | ||||||||||
| Income from discontinued operations, (net of income taxes) |
– | – | 0.01 | – | – | |||||||||||||||
| Net income per share |
$ | 1.20 | $ | 1.12 | $ | 0.72 | $ | 1.00 | $ | 0.90 | ||||||||||
| Net income per diluted share: | ||||||||||||||||||||
| Income from continuing operations | $ | 1.19 | $ | 1.11 | $ | 0.70 | $ | 0.99 | $ | 0.89 | ||||||||||
| Income from discontinued operations, (net of income taxes) |
– | – | 0.01 | – | – | |||||||||||||||
| Net income per share |
$ | 1.19 | $ | 1.11 | $ | 0.71 | $ | 0.99 | $ | 0.89 | ||||||||||
| Weighted average shares outstanding | ||||||||||||||||||||
| Basic | 8,984 | 8,937 | 8,662 | 8,480 | 8,445 | |||||||||||||||
| Diluted | 9,068 | 8,970 | 8,817 | 8,630 | 8,545 | |||||||||||||||
| Cash dividends paid on common stock | $ | 6,300 | $ | 6,479 | $ | 9,083 | $ | 11,912 | $ | 12,008 | ||||||||||
| Cash dividends declared per share of common stock |
$ | 0.70 | $ | 0.70 | $ | 1.05 | $ | 1.40 | $ | 1.40 | ||||||||||
| At June 30, |
||||||||||||||||||||
| 2020 | 2019 | 2018 | 2017 | 2016 | ||||||||||||||||
| Balance Sheet Data: |
(In thousands) |
|||||||||||||||||||
| Cash and cash equivalents | $ | 28,640 | $ | 19,225 | $ | 10,581 | $ | 9,826 | $ | 11,967 | ||||||||||
| Working capital – continuing operations | 15,266 | 11,704 | 5,760 | 5,799 | 6,980 | |||||||||||||||
| Working capital (deficit) – discontinued operations |
– | – | – | (391 | ) | (619 | ) | |||||||||||||
| Goodwill and Intangibles – continuing | 4,071 | 4,412 | 4,402 | 4,266 | 3,845 | |||||||||||||||
| Total assets – continuing operations | 55,482 | 37,693 | 32,214 | 28,530 | 28,111 | |||||||||||||||
| Total assets – discontinued operations | – | – | – | 79 | 79 | |||||||||||||||
| Stockholders’ equity | $ | 25,012 | $ | 18,947 | $ | 14,268 | $ | 15,917 | $ | 14,995 | ||||||||||
| (i) | Selling, general and administrative expenses (“SG&A”) include non-cash stock-based compensation expense of $1,575,000, $974,000, $1,421,000, $4,025,000 and $596,000 in fiscal 2020, 2019 2018, 2017 and 2016, respectively. See Management’s Discussion and Analysis of Financial Condition and Results of Operations-Critical Accounting Policies and Estimates: Stock-Based Compensation Expense and Results of Operations-Stock-Based Compensation Expense below. In addition, in fiscal 2020, SG&A includes higher legal expenses of $1,114,000 (of which $967,000 were related to pre-trial settlements). |
|
| (ii) | The impairment charge relates to our Expos business and was recognized in the fourth quarter of fiscal 2020. See Management’s Discussion and Analysis of Financial Condition and Results of Operations – Recent Development-Coronavirus (“COVID-19”) below. |
| ITEM 7. |
MANAGEMENT’S DISCUSSION AND ANALYSIS OF FINANCIAL CONDITION AND RESULTS OF OPERATIONS |
The
following discussion and analysis of our financial condition and results of operations should be read in conjunction with the
“Selected Consolidated Financial Data” included above and our Consolidated Financial Statements and the related notes,
included below in this Part II of this Annual Report. This discussion also should be read in conjunction with the information
in Item IA of Part I of this Report, entitled “Risk Factors,” which contains information about certain risks and uncertainties
that can affect our business and our financial performance in the future.
Introduction
and Overview
Our
Business
Collectors
Universe, Inc. (“we”, “us” “our” or the “Company”) provides authentication and
grading services to dealers and collectors of coins, trading cards, event tickets, autographs, and sports and historical memorabilia.
We believe that our authentication and grading services add value to these collectibles by providing dealers and collectors with
a high level of assurance as to the authenticity and quality of the collectibles they seek to buy or sell; thereby enhancing their
marketability and providing increased liquidity to the dealers and collectors and consumers that own, buy and sell such collectibles.
We
principally generate revenues from the fees paid by our customers for our authentication and grading services. To a much lesser
extent, we generate revenues from “other related revenues” which consist of: (i) the sale of advertising and commissions
earned on our websites; (ii) the sale of printed publications, and advertising in those publications; (iii) the sale of membership
subscriptions in our Collectors Club, which is designed primarily to attract interest in collectibles among collectors; (iv) the
sale of subscriptions to our CCE dealer-to-dealer Internet bid-ask market for certified coins; and (v) the management and operation
of collectibles trade shows and conventions. We also generate revenues from sales of our collectibles inventory, which is primarily
comprised of collectible coins that we have purchased under our coin grading warranty program; however, such product sales are
neither the focus of nor an integral part of, our on-going revenue generating activities.
Recent
Developments: Coronavirus (“COVID-19”)
Despite
COVID-19, our business achieved record revenues of $78.9 million and operating income of $14.1 million in fiscal 2020 as compared
to revenues of $72.5 million and operating income $14.3 million in fiscal 2019. Set forth below is a summary of the impact of
COVID -19 on fiscal 2020 and what we believe, at this time, could be the possible future effects on our business.
As
previously reported, on March 20, 2020 we shut down our authentication and grading operations in California as a result of a state-wide
“shelter-in-place” and “stay-at-home” orders issued by the Governor of California. As a result, in the
third quarter ended March 31, 2020 (which is typically our biggest revenue quarter of the year), our revenues declined by $0.7
million, or 4%, as compared to the third quarter of fiscal 2019 and as compared to a 19% growth in revenues in the first half
of fiscal 2020. Furthermore, our operating income declined by $2.1 million, or 45%, as compared to the third quarter of fiscal
2019 and as compared to a 57% increase in operating income in the first half of fiscal 2020. Contributing to the decrease in operating
income in this year’s third quarter was our decision to continue paying the salaries of all employees through March 31,
2020 despite closing our operations on March 21, 2020.
| ● | On April 15, 2020, we resumed our authentication and grading operations in California, albeit on a limited basis, in order primarily, to assist dealers and collectors of investment assets, consisting of coins and other high-value collectibles, in selling and increasing the liquidity of those assets. At that time, we implemented enhanced measures to protect the health and safety of our returning employees and the community. Those health and safety measures included a reconfiguration of our authentication and grading facility to permit social distancing and continuing to have certain administrative and clerical personnel work remotely from their homes. As a result, there were inefficiencies in our business that did not exist prior to the COVID-19 outbreak, although we mitigated the effect of those inefficiencies by operating with multiple shifts and making extra space available to operations personnel that was previously used by the clerical personnel working remotely. With the safety measures in place we ramped up our operations and resumed accepting submissions from customers in May and June 2020. Our cards and autographs business already had a strong backlog of submissions for authentication and grading prior to the closure of our operations in March 2020. As a result, we generated record revenues of $20.5 million and earned operating income of $3.5 million in the fourth quarter ended June 30, 2020 as compared to revenues of $19.8 million and operating income of $4.5 million in the fourth quarter of fiscal 2019. In addition, we increased our cash and cash equivalents from $22.2 million at March 31, 2020 to $28.6 million at June 30, 2020. See Quarterly Results of Operations below which highlights certain additional costs in this year’s fourth quarter. |
| ● | Our Expos Long Beach trade shows scheduled to take place in the fourth quarter of fiscal 2020 and the first quarter of fiscal 2021 were cancelled due to COVID-19 and there continues to be uncertainty as to the viability of the Expos trade show business, due to social distancing concerns that will limit the numbers of dealers and attendees at future shows. As a result, in the fourth quarter of fiscal 2020, we recognized a non-cash impairment charge of $486,000 relating to the write-off of the remaining goodwill and intangible assets of that business, which reduced operating income in the fourth quarter. |
|
| ● | We earn higher average service fees for onsite authentication and grading activities at coin and to a lesser extent, trading card trade shows. In the fourth quarter of fiscal 2020, coin trade shows were cancelled due to social distancing issues and travel restrictions, which mostly eliminated our trade show revenues in the quarter, although when possible, we requested customers to redirect potential show submissions to our California operations facility for authentication and grading. The National Sports Collectors Convention, and the PNG/ANA Numismatic Trade Show which are the largest trade shows for our cards and autographs and coin businesses, which had been scheduled for July and August 2020 have been cancelled. There continues to be uncertainty as to which, if any, trade shows will occur in the first and future quarters of fiscal 2021 although, we expect to be able to conduct and/or replace some of the cancelled U.S. coins shows with smaller coin authentication and grading events. In addition, we will continue to, when possible, redirect trade show submissions to our California operations facility, for authentication and grading. |
|
| ● | There continues to be uncertainty as to the U.S. Mint’s production and release schedule for modern coin programs through the end of the calendar year 2020, although to date in the first quarter of fiscal 2021 our domestic modern coin revenues are at the same levels during the same period of last year’s first quarter. |
|
| ● | Our China operation, in the fourth quarter of fiscal 2020 generated higher revenues than in the third quarter (as COVID-19 led to the disruption of the China operation in the third quarter). Despite a strong backlog of submissions for authentication and grading in China at June 30, 2020, it continues to be difficult to ramp up our operations in China to pre-COVID-19 levels, for now, due to the continuing travel restrictions, that prevent our U.S. coins experts from travelling to China in support of authentication and grading events there. |
|
| ● | Despite the uncertainties arising from COVID-19 discussed above, our cards and autographs business had a record backlog as of June 30, 2020 and continues to experience strong customer submissions. To address that backlog, we have been increasing operating capacity in the first quarter of fiscal 2021, with the objective of improving the performance of those parts of the business that continue to have a strong demand for our services. We will also be seeking to identify and take advantage of opportunities that may present themselves in other parts of the business where demand for our services are currently uncertain. |
Factors
That Can Affect Operating Results and our Financial Position in Addition to COVID-19
Factors
That Can Affect our Revenue. Our authentication and grading fees accounted for approximately 90% of our total net revenues
in the year ended June 30, 2020. The amounts of those fees are primarily driven by the volume and mix of coins and trading cards
and collectibles sales and purchase transactions by collectibles dealers and collectors, because our authentication and grading
services generally facilitate sales and purchases of coins and trading cards by providing dealers and collectors with a high level
of assurance as to the authenticity and quality of the collectibles they seek to sell or buy. Consequently, dealers and collectors
most often submit coins, trading cards and autographs to us for authentication and grading at those times when they are in the
market to sell or buy those collectibles.
The
amounts of our authentication and grading revenues are affected by (i) the volume and mix of authentication and grading submissions
among coins and trading cards, (ii) in the case of coins and trading cards, the “turnaround” times requested by our
customers, because we charge higher fees for faster service times; and (iii) the mix of authentication and grading submissions
between vintage or “classic” coins and trading cards, on the one hand, and modern coins and trading cards, on the
other hand, because, vintage or classic collectibles are of significantly higher value and justify a higher average service fee.
Our
U.S. coin authentication and grading revenues are also impacted by the volume of modern coin submissions, which can fluctuate
from period to period, depending on the timing and size of modern coin marketing programs conducted by the United States Mint
and by customers or dealers who specialize in sales of such coins.
Our
revenues are also affected by the volume of coin authentication and grading submissions we receive at collectibles trade shows
where we provide on-site authentication and grading services to show attendees, because they typically request higher-priced same-day
turnaround for the coins they submit to us for authentication and grading at those shows. The level of trade show submissions
varies from period to period, depending upon a number of factors, including the number and the timing of the shows in each period
and the volume of collectible coins that are bought and sold at those shows by dealers and collectors. In addition, the number
of such submissions and, therefore, the revenues and gross profit margin we generate from the authentication and grading of coins
at trade shows can be impacted by short-term changes in the prices of gold that can occur around the time of the shows, because
gold prices can affect the willingness of dealers and collectors to sell and purchase coins at the shows.
Due
to mix issues discussed above, the number of collectibles authenticated and graded, and the fees that they generate can vary by
period between coins, and cards and autographs. For example, the total numbers of collectibles authenticated and graded by the
Company was approximately 5.0 million, 4.6 million and 4.8 million units in fiscals 2020, 2019 and 2018, respectively, of which,
coins represented 42%, 47% and 59%, in fiscals 2020, 2019 and 2018, respectively, and cards and autographs represented 58%, 53%
and 41%, in the same respective periods. Coin fees represented 55%, 62% and 68%, of total authentication and grading fees in fiscals
2020, 2019 and 2018, respectively, and cards and autographs fees represented 45%, 38% and 32% of those fees in the same respective
periods, as average service fees are generally higher for coins than for cards and autographs, and for vintage units than for
modern units. See Results of Operations: Net Revenues below, which discusses revenues in greater detail.
Five
of our customers (all of which were coin customers) accounted, in the aggregate, for approximately 10%, 11% and 16% of our total
net revenues in the years ended June 30, 2020, 2019 and 2018, respectively. In fiscal 2018 a banking channel customer in China,
accounted for about 6% of net revenues. As a result, the loss of any of those customers, or a significant decrease in the volume
of grading submissions from any of them to us, could cause our net revenues to decline and, therefore, could adversely affect
our results of operations.
Factors
Affecting our Gross Profit Margins. The gross profit margins we earn on collectibles authentication and grading submissions
are impacted by many of the same factors that impact our revenues, as the average service fee and the resulting gross profit margin
earned is affected by (i) the volume and mix of those submissions among coins, trading cards and other collectibles, because we
generally realize higher margins on coin submissions than on submissions of other collectibles; (ii) in the case of both coins
and trading cards, the “turnaround” times requested by our customers, because we charge higher fees for faster service
times, and (iii) the level of other related revenues in any reporting period. In addition, because a significant proportion of
our costs of sales are relatively fixed, our gross profit margin is also affected as we build authentication and grading capacity
in response to the record cards and autographs backlog (as there is a delay between incurring the cost of additional capacity
and the resulting full revenue benefits) and by the overall volume of collectibles that we authenticate and grade in any period.
Impact
of Economic Conditions on our Financial Performance. As discussed above, our operating results are affected primarily by the
number of collectibles transactions by collectibles dealers and collectors which, in turn, is primarily affected by (i) the cash
flows generated by collectibles dealers and their confidence about future economic conditions, which affect their willingness
and the ability of such dealers to purchase collectibles for resale; (ii) the availability and cost of borrowings because collectibles
dealers often rely on borrowings to fund their purchases of collectibles, (iii) the disposable income available to collectors
and their confidence about future economic conditions, because high-value collectibles are generally purchased with disposable
income; (iv) prevailing and anticipated rates of inflation and the strength or weakness of the U.S. dollar, and uncertainties
regarding the strength of the economy in the United States, Western Europe and China, because conditions and uncertainties of
this nature often lead investors and consumers to purchase or invest in gold and silver coins as a hedge against inflation or
reductions in the purchasing power of the U.S. currency; as well as an alternative to investments in government bonds and other
treasury instruments; and (v) the performance and volatility of the gold and other precious metals markets, which can affect the
level of purchases and sales of collectible coins, because investors and consumers will often increase their purchases of gold
coins, as well as other hard assets if they believe that the market prices of those assets will increase. As a result, the volume
of collectibles transactions and, therefore, the demand for our authentication and grading services, generally increase during
periods characterized by increases in disposable income and the availability of lower cost borrowings, on the one hand, or increases
in inflation or in gold prices, economic uncertainties and declines in business and consumer confidence or a weakening of the
U.S. dollar on the other hand. By contrast, collectibles transactions and, therefore, the demand for our services generally decline
during periods characterized by economic downturns or recessions, declines in consumer and business confidence, an absence of
inflationary pressures, or periods of stagnation or a downward trend in the market prices of gold. However, these conditions can
sometimes counteract each other as it is not uncommon, for example, for investors to shift funds from gold to securities or other
investments during periods of economic growth and growing consumer and business confidence and from stocks and other investments
to gold during periods of economic uncertainties and decreases in disposable income and consumer and in business confidence. Since
July 1, 2020, gold prices have increased in the United States which we believe is due primarily to the economic uncertainties
created by the COVID-19 pandemic. Based on historical experience, strong gold prices can over time lead to increases in coin authentication
and grading submissions to us.
Factors
That Can Affect our Liquidity and Financial Position. A substantial number of our authentication and grading customers pay
our authentication and grading fees when they submit their collectibles to us for authentication and grading, or prior to the
shipment of the collectible back to them. As a result, historically, we have been able to rely on internally generated cash to
fund our continuing operations. However, as discussed in note 7 to the Consolidated Financial Statements included elsewhere in
this Annual Report, and in “Liquidity and Capital Resources—Outstanding Financial Obligations” below,
to augment our cash resources, in March 2020 the Company increased its revolving and unsecured credit line to $15 million from
$10 million and extended its line of credit by two years. In addition, in the first half of fiscal 2018, the Company borrowed
$3 million under an unsecured term loan, primarily to fund capital expenditures and costs associated with the move to our new
operations and headquarters facility, in the second quarter of fiscal 2018.
In
addition to the operating performance of our businesses, and in particular our coin and cards and autographs authentication and
grading businesses, which account for over 90% of our revenues, our overall financial position can also be affected by other factors,
including the Company’s tax position and effective tax rates, our obligation to repay borrowings under our Term Loan, the
dividend policy adopted by the Board of Directors from time to time, the level of capital expenditures, the decisions to invest
in and to fund start-ups of or the acquisition of new businesses and any capital raising activities or stock repurchases. Furthermore,
our domestic cash position can be impacted by delays in the timing of the repatriation of cash balances back to the United States
from China, due to the exchange control regulations in China.
On
February 4, 2018, the Board of Directors approved a reduction in the amount of our future quarterly cash dividends to $0.175 per
share, from $0.35 per share, primarily to provide the Company with additional cash that the Board of Directors believes will be
needed to grow the Company’s existing businesses, to fund other potential growth opportunities and to enhance the Company’s
financial flexibility. The Board of Directors also concluded that this change in dividend will make the payment of future cash
dividends sustainable for a longer period of time.
We
currently expect that internally generated cash flows, current cash and cash equivalent balances and availability of borrowings
under our revolving line of credit, will be sufficient to fund our continuing operations at least through the end of fiscal 2021.
Trends
in our Businesses
Our
overall financial performance is largely dependent on the performance of our coins and trading cards and autographs authentication
and grading businesses which can be impacted by the matters as discussed above. Although our coin business, which accounted for
53%, 57% and 63% of consolidated revenues in fiscal 2020, 2019 and 2018, respectively, continues to be our largest business, our
cards and autographs business is growing more rapidly than our coin business and accounted for 43%, 36% and 31% of our consolidated
revenues in fiscal 2020, 2019 and 2018, respectively. Our quarterly results can also be significantly impacted by seasonality
and the timing of revenues from modern coin programs (that are largely dependent on new coins issuances from the US Mint) and
the number of tradeshows or grading events that occur in a quarter both domestically and overseas. Our cards and autographs business
is less affected by seasonality, due to the record backlog and strong customer submissions currently being experienced by that
business. See “Factors That Can Affect our Revenue” above.
Overview
of Fiscal 2020 Operating Results
The
following table sets forth comparative financial data for the years ended June 30, 2020 and 2019 (in thousands):
| Year Ended June 30, 2020 |
Year Ended June 30, 2019 |
|||||||||||||||
|
Amount |
Percent of Revenues |
Amount |
Percent of Revenues |
|||||||||||||
| Net revenues | $ | 78,891 | 100.0 | % | $ | 72,453 | 100.0 | % | ||||||||
| Cost of revenues | 33,655 | 42.7 | % | 30,153 | 41.6 | % | ||||||||||
| Gross profit | 45,236 | 57.3 | % | 42,300 | 58.4 | % | ||||||||||
| Selling and marketing expenses | 9,436 | 11.9 | % | 10,361 | 14.3 | % | ||||||||||
| General and administrative expenses | 21,212 | 26.9 | % | 17,597 | 24.3 | % | ||||||||||
| Impairment Charge | 486 | 0.6 | % | – | – | |||||||||||
| Operating income | 14,102 | 17.9 | % | 14,342 | 19.8 | % | ||||||||||
| Interest income, (expense) net | 78 | 0.1 | % | (69 | ) | (0.1 | )% | |||||||||
| Other income (expense) |
15 | – | (148 | ) | (0.2 | )% | ||||||||||
| Income before provision for income taxes | 14,195 | 18.0 | % | 14,125 | 19.5 | % | ||||||||||
| Provision for income taxes |
3,409 | 4.3 | % | 4,148 | 5.7 | % | ||||||||||
| Net Income | $ | 10,786 | 13.7 | % | $ | 9,977 | 13.8 | % | ||||||||
| Net income per diluted share: | $ | 1.19 | $ | 1.11 | ||||||||||||
Despite
the adverse impact of COVID-19, on our third and fourth quarters of fiscal 2020, net revenues increased by $6.4 million, or 9%,
to a record $78.9 million in fiscal 2020, from $72.5 million generated in fiscal 2019. The increase, primarily comprised (i) increased
cards and autographs revenues of $7.2 million or 27%, and (ii) increased China revenues of $1.0 million or 24%, partially offset
by decreases in our other coin revenues of $0.8 million. In addition, revenues from our non-grading and authentication businesses
and activities, decreased by $1.0 million.
Operating
income was $14.1 million in fiscal 2020 as compared to $14.3 million in fiscal 2019 and reflected (i) higher general and administrative
expenses in fiscal 2020, including approximately $1.0 million of pre-trial litigation settlements and approximately $0.6 million
of higher non-cash stock based compensation and (ii) an impairment charge of $0.5 million, related to our Expos trade show business.
These,
as well as other factors affecting our operating results are described in more detail below. Also, see “Recent Developments:
Coronavirus (“COVID-19”)”, above in this Item 7 and “Factors that Can Affect our Operating Results
and Financial Position” and “Results of Operations”, below.
Critical
Accounting Policies and Estimates
General.
In accordance with accounting principles generally accepted in the United States of America (“GAAP”), we record
our assets at the lower of cost, net realizable value or fair value. In determining the fair value of certain of our assets, principally
accounts receivable, inventories, goodwill, capitalized software and intangible assets, we must make judgments, estimates and
assumptions regarding circumstances or trends that could affect the value of those assets, such as economic conditions or circumstances
that could impact, for example our ability to fully collect our accounts receivable or realize the value of our inventories, in
future periods. Those judgments, estimates, and assumptions are based on current information available to us at the time we make
such determinations. Many of these conditions and circumstances on which our judgments or estimates are based; however, are outside
of our control and, if changes were to occur in the events, or other circumstances on which our judgments or estimates were based,
or other unanticipated events were to happen that might affect our operations, we may be required under GAAP to adjust our earlier
estimates. Changes in such estimates may require that we reduce the carrying values of the affected assets on our balance sheet
(which are commonly referred to as “write-downs” of the assets involved).
It
is our practice to establish reserves, allowances, charges or losses to record such downward adjustments or write-downs in the
carrying values of assets, such as, for example, accounts receivable and inventory. Such write-downs are recorded as charges to
income or increases in expense in our statement of operations in the period when those reserves, allowances, charges or losses
are established or increased to take account of changed conditions or events. As a result, our judgments, estimates and assumptions
about future events and changes in the conditions, events or trends upon which those estimates and judgments were made, can and
will affect not only the amounts at which we record such assets on our balance sheet, but also our results of operations.
The
decisions as to the timing of adjustments or write-downs of this nature also require subjective evaluations or assessments and
judgments about the effects and duration of events or changes in circumstances. For example, it is difficult to predict whether
events or conditions, such as COVID-19, changes in interest rates or economic slowdowns, will have short or longer term consequences
for our business, and it is not uncommon for it to take some time after the occurrence of an event or the onset of changes in
economic circumstances for their full effects to be recognized. Therefore, we make such estimates based upon the information available
to us at that time and reevaluate and adjust the Company’s reserves, allowances, charges or losses on a quarterly basis.
On
a quarterly basis, we make estimates or judgements with respect to the (i) valuation of stock-based compensation awards and the
timing and recognition of related stock-based compensation expense for the performance shares that are part of the Company’s
Long-Term Incentive Plans, (ii) the amount and adequacy of warranty reserves, (iii) the provision for income taxes and the timing
of related valuation allowances, (iv) the carrying value of capitalized software costs (v) the valuation of coin and grading consumable
inventory, (vi) the impairment of goodwill and other intangible assets and (vii) litigation related accruals.
In
making our estimates and assumptions, we follow GAAP in order to make fair and consistent estimates of the fair value of assets
and to establish adequate reserves, allowances, charges or losses for possible write-downs in the carrying values of our assets
or the recognition of liabilities.
Set
forth below is a summary of the accounting policies and critical estimates that we believe are material to an understanding of
our financial condition and results of operations.
Leases
Effective
July 1, 2019 the Company adopted Accounting Standards Codification (“ASC”) 842 Accounting for Leases and recognized
lease obligations and corresponding right-of-use (ROU) assets for its existing non-cancelable operating leases. The core principle
of this guidance is that a lessee should recognize the assets and liabilities that arise from leases. Therefore, the Consolidated
Balance Sheet at June 30, 2020, included elsewhere in this report, includes the liability to make lease payments (the lease liability)
and a right-of-use asset, representing our right to use the underlying asset for the lease term. We elected not to recognize lease
assets and liabilities for leases with a term of 12 months or less and are recognizing lease expenses for such leases on a straight-line
basis over the lease term. The Company adopted this new accounting guidance, utilizing the current period adoption method without
revising comparative periods and elected not to reassess existing leases. The new standard provides a number of optional practical
expedients in transition. The Company elected to use the package of practical expedients that allows us to not reassess: (i) whether
any expired or existing contracts are or contain leases, (ii) lease classification for any expired or existing leases and (iii)
initial direct costs for any expired or existing leases. In addition, the new standard provides for an accounting election that
permits a lessee to elect not to apply the recognition requirements of Topic 842 to short-term leases by class of underlying asset.
The Company adopted this accounting election for all classes of assets. The Company’s leases consist primarily of office
facilities and the adoption of the new lease standard on July 1, 2019 resulted in the recognition of right-of-use assets of approximately
$9.8 million and lease liabilities for operating leases of approximately $13.6 million on the consolidated balance sheets, with
no material impact on the consolidated statements of operations or consolidated statements of cash flows. See “Note 9-Leases”
for additional information. As a result of COVID-19, we reviewed our lease obligations for impairment and potential excess space
reserve requirements and concluded there were no impairments or charges, required at June 30, 2020.
Revenue
Recognition
The
core principle of ASC 606, Revenue from Contracts with Customers, is that an entity recognizes revenue to depict the transfer
of promised goods or services to customers in an amount that reflects the consideration to which the entity expects to be entitled
in exchange for those goods or services. In applying ASC 606, all revenue transactions must be evaluated using a five-step approach
to determine the amount and timing of revenue to be recognized. The five-step approach requires (1) identifying the contract with
the customer, (2) identifying the performance obligations in the contract, (3) determining the transaction price, (4) allocating
the transaction price to the performance obligations in the contract and (5) recognizing revenue when performance obligations
are satisfied.
Our
primary source of revenue is the authentication and grading of collectibles, which represented about 90% of our consolidated revenues
in fiscal 2020. Our other sources of revenues represent the balance of our revenues which are small and individually account for
less than five percent of total revenues.
In
accordance with ASC 606 we recognize revenue for our main revenue streams as follows:
Authentication
and Grading Revenues: As the time it takes to authenticate and grade the collectible is short, we recognize revenue at the
time of shipment (i.e. point of time) of the authenticated graded collectible to the customer, net of any taxes collected. Due
to the insignificant delay between the completion of our authentication and grading services and the shipment of the collectible
back to the customer, the time of shipment corresponds to the completion of our services. We recognize revenue from the sale of
special coin inserts at the time the customer takes legal title to the insert. Many of our authentication and grading customers
prepay our authentication and grading fees when they submit their collectibles to us for authentication and grading. We record
those prepayments as deferred revenue until the collectibles have been authenticated and graded and shipped back to the customer.
At that time, we record the revenues from the authentication and grading services we have performed for the customer and deduct
this amount from deferred revenue. For certain dealers to whom we extend credit, we record revenue at the time of shipment of
the authenticated and graded collectible to the dealer. We provide a limited warranty covering the coins and trading cards that
we authenticate and grade. See Warranty Costs below.
Collectors
Club Revenues: These revenues represent membership fees paid by customers for annual memberships in our Collectors Club. Those
membership fees entitle members to access our on-line and printed publications and, depending on their membership level, to receive
vouchers for authentication and grading services during the membership period. We allocate revenue between the vouchers and the
membership. We recognize revenue attributable to the authentication and grading vouchers consistent with our authentication and
grading services above. The balance of the membership fees is recognized ratably over the life of the membership. Memberships
are paid in advance of the membership period and prepaid memberships fees are classified as deferred revenue. In the event vouchers
expire unused (i.e. there are unexercised customer rights), we consider the guidance under ASC 606 in determining when to recognize
revenue.
Certified
Coin Exchanges Subscription Revenues: We recognize subscription revenues related to our CCE exchange for certified coins,
ratably over the relevant subscription period. Subscriptions are typically billed and paid on a monthly basis, although certain
quarterly and annual subscriptions can be paid in advance. Prepaid subscriptions are classified as part of deferred revenue.
Expos
Trade Show Revenue: We recognize fees earned from promoting, managing, and operating trade shows in the periods in which the
shows take place. Trade show booth fees are typically paid to us in advance. Certain fees that are paid to conduct auctions at
the show are paid to us at the end of the show. Prepaid show fees are classified as part of deferred revenue.
Advertising
and Commission Revenues: Advertising revenues are recognized in the period when an advertisement is displayed in our publications
or websites and customers typically have 30 day credit terms. Click-through commission revenues earned through our websites from
third party affiliate programs are recognized in the period in which the commissions are earned, and such commissions are paid
in the following month.
Product
Sales: Product sales consist primarily of sales of collectibles coins that we have purchased pursuant to our coin authentication
and grading warranty program. We recognize revenues from coin sales when the coins are shipped or delivered to customers or if
the coins are sold through auction, when the auction settles. However, those sales are not considered to be the focus of nor an
integral part of the Company’s ongoing revenue generating activities.
Contract
Balances. As discussed above, the timing of revenue recognition can differ from the timing of invoicing to customers. Contract
liabilities are comprised of billings or payments received from our customers in advance of performance under the contract. We
refer to these contract liabilities as “Deferred Revenue”. During fiscal 2020, we recognized revenue for substantially
all of the deferred revenue balance of $3,428,000 at June 30, 2019.
Shipping
and Handling Costs
Shipping
and handling costs incurred to process and return customer collectibles submitted to us for grading or authentication are recorded
as costs of revenues, net of amounts received from customers, in accordance with the guidance for Principals versus Agents as
set out in ASC 606.
Accounts
Receivable and the Allowance for Doubtful Accounts. In the normal course of our authentication and grading business, we extend
payment terms to many of the larger, more creditworthy dealers who submit collectibles to us for authentication and grading on
an ongoing basis. We regularly review our accounts receivable and exercise judgment in estimating the amounts of, and establish
an allowance for, uncollectible accounts in each quarterly period. The amount of that allowance is based on several factors, including
the age and extent of significant past due accounts and known conditions or trends that may affect the ability of account debtors
to pay their accounts receivable balances. Each quarter we review our estimates of uncollectible amounts and, if necessary, adjust
the allowance to take account of changes in economic or other conditions or trends that we believe will have an adverse effect
on the ability of any of our specific account debtors to pay their accounts in full. Since the allowance is increased by recording
a charge against income that is reflected in general and administrative expenses, an increase in the allowance will cause an increase
in such expenses. At June 30, 2020 and 2019, the allowance for doubtful accounts was $98,000, and $72,000, respectively.
Inventory
Valuation Reserves. Our collectibles inventories, which consist of collectible coins that we have purchased pursuant to our
coin warranty program and other consumable inventory related to our authentication and grading activities, are valued at the lower
of cost or estimated fair value and have been reduced by an inventory valuation allowance to provide for potential declines in
the value of those inventories below their carrying values. The amount of the allowance is determined and is periodically adjusted
on the basis of market knowledge, historical experience and estimates concerning future economic conditions or trends that may
impact the sales value of the collectibles inventories. Additionally, due to the relative uniqueness and special features of some
of the collectible coins included in our collectibles inventory and the volatility in the prices of precious metals, valuation
of such collectibles often involves judgments that are more subjective than those that are required when determining the market
values of more standardized products. As a result, we review the estimated market values of the collectibles in our inventory
on a quarterly basis and make adjustments to the valuation reserve that we believe are necessary or prudent based on our judgments
regarding these matters. In the event that a collectible is sold for a price below its carrying value, we record a charge to cost
of services. In addition, we review our other consumable inventory on a regular basis for recoverability and expected future usage
and, if considered necessary, establish reserves for those items that have no future value to us. At June 30, 2020 and 2019, gross
inventories were $3,584,000 and $3,243,000, respectively, and inventory reserves were $1,072,000 and $1,278,000, respectively.
See Note 3 to the Consolidated Financial Statements. If we liquidate collectible coins at amounts below their carrying values,
we may incur losses in excess of our recorded inventory reserves.
Warranty
Costs. We offer a limited warranty covering the coins and trading cards that we authenticate and grade. Under the warranty,
if a coin or trading card that was previously authenticated and graded by us is later submitted to us for re-grading and either
(i) receives a lower grade upon re-submittal or (ii) is determined not to have been authentic, we will offer to purchase the collectible
for a price equal to the value of collectible at its original grade, or, at the customer’s option, pay the difference between
the value of the collectible at its original grade as compared with the value at its lower grade. However, this warranty is voided
if the collectible, upon re-submittal to us, is not in the same tamper-resistant holder in which it was placed at the time we
last graded the item or if we otherwise determine that the collectible had been altered after we had authenticated and graded
it. If we purchase an item under a warranty claim, we recognize the difference in the value of the item at its original grade
and its re-graded estimated value as a reduction in our warranty reserve. We include the purchased item in our inventory at the
estimated value of the re-graded collectible, which will be lower than the price we paid to purchase the item. We accrue for estimated
warranty costs based on historical trends and related experience, and we monitor the adequacy of our warranty reserve on an ongoing
basis. There also are a number of factors that can cause the estimated values of the collectibles purchased under our warranty
program to change over time and, as a result, we review the market values of those collectibles on a quarterly basis (see Inventory
Valuation Reserves above). However, once we have classified such items as inventory and they have been held in inventory beyond
the end of the fiscal quarter in which we purchased them, we classify any further losses in the estimated fair value of the items
or the subsequent disposal of such items, as part of the gain or loss on product sales on a quarterly basis.
We
recognized warranty expense of $462,000, $568,000 and $764,000 in fiscal years 2020, 2019, and 2018, respectively. Our warranty
reserves were $698,000 and $852,000 at June 30, 2020 and 2019, respectively.
Goodwill.
We test the carrying value of goodwill and other indefinite-lived intangible assets at least annually on their respective
acquisition anniversary dates, or more frequently if indicators of impairment are determined to exist. When testing for impairment,
we consider qualitative factors, and where determined necessary, we proceed to a formal goodwill impairment test in accordance
with FASB 2017-04 on Simplifying the Test for Goodwill Impairment. We use a discounted cash flow model or an income approach
to estimate the fair value of the reporting unit on a total basis, which is then compared to the carrying value of the reporting
unit. If the fair value of the reporting unit exceeds the carrying value of the reporting unit, no impairment of goodwill exists
as of the measurement date. If the fair value is less than the carrying value, we recognize goodwill impairment for that difference.
During
the first quarter of fiscal 2020, which ended September 30, 2019, we completed the annual impairment evaluations with respect
to the goodwill acquired in our fiscal year 2006 purchases of CCE and CoinFacts. We assessed qualitative factors, including the
significant excess of fair values over carrying values in prior years, and any material changes in the estimated cash flows of
those reporting units, and determined that it was more likely than not that the respective fair values of CCE and CoinFacts exceeded
their respective carrying values, including goodwill, and as a result, there was no impairment. There were no impairment triggers
identified for these businesses through June 30, 2020.
With
respect to our Expos trade show business, we typically perform our annual goodwill impairment evaluation as of June 30 of each
fiscal year. As a result of COVID-19 and as discussed under Recent Developments: Coronavirus (“COVID-19”) above,
we concluded that the Expos business was impaired, due to two shows having already been cancelled and the uncertainty as to the
future viability of that business as a result of social distancing and the timing of future shows. Therefore at June 30, 2020,
we recognized an impairment charge for the remaining Expos goodwill of $458,000.
Long-Lived
Assets Other Than Goodwill. We regularly conduct reviews of property and equipment and other long-lived assets other than
goodwill, including certain identifiable intangibles, for possible impairment. Such reviews occur annually, or more frequently,
if events or changes in circumstances indicate the carrying amount of the asset may not be recoverable in full. In order to determine
if the value of a definite-lived asset is impaired, we make an estimate of the future undiscounted cash flows expected to result
from the use of that asset and its eventual disposition in order to determine if an impairment loss has occurred. If the projected
undiscounted cash flows are less than the carrying amount of the asset, an impairment loss is recorded to write-down the asset
to its estimated fair value. As discussed above under Goodwill, we concluded that Expos business was impaired and therefore
at June 30, 2020, we recognized an impairment charge for the remaining intangible assets of $28,000.
Stock-Based
Compensation Expense. Stock-based compensation expense is measured at the grant date fair value of a restricted share awards
and is recognized as expense over the employee’s or non-employee director’s requisite service period, which is generally
the vesting period of the award. However, if the vesting of a stock-based compensation award is subject to satisfaction of a performance
requirement or condition, stock-based compensation expense is recognized if, and when, (i) performance goals have been established
for the vesting of shares and (ii) it is determined that the achievement of the performance requirement or condition (and therefore,
the vesting of the award) has become probable. If stock-based compensation is recognized due to a determination that a performance
condition has become probable, but it is subsequently determined that the performance condition was not met in the expected vesting
period, then if the shares may still vest in future periods, we will extend the period over which the remaining expense would
be recognized. If the award fails to vest, or we conclude that it is not probable the shares will vest, then all previously recognized
expense with respect to that performance condition would be reversed.
Stock
Awards
In
recent years, to create incentives for management, to remain in the service of the Company and to drive cash generation, restricted
stock awards are made on an annual basis to officers and key employees under Long Term Incentive Plans (“LTIPs”) comprising
service-based awards (“RSUs”) and performance based-awards (“PSUs”). In addition, there are annual RSU
awards to directors for their annual services as directors and special awards to certain officers or employees, at the discretion
of the Compensation Committee of the Board of Directors.
In
all instances for the awards to vest the employee or outside director must provide continuous service through the vesting date
of the award. In the event of a termination of continuous service, for any reason, prior to its vesting date, the award is forfeited.
Fiscal
2020, 2019 and 2018 LTIP Awards
RSUs
One
Time Award. A total, net of forfeitures, of 17,505 RSUs were awarded in December 2017, which vested in two installments, on
June 30, 2019 and 2018, respectively. Through June 30, 2019 these service shares were fully vested.
Annual
Awards. A total, net of forfeitures, of 25,952, 44,763 and 16,731 RSUs were awarded in fiscal 2020, 2019 and 2018, respectively,
with vesting in three annual installments on the last day of the fiscal years following the grants.
At
June 30, 2020 17,303 and 15,519 of the fiscal 2020 and 2019 awards remained unvested.
Fiscal
2020 and 2019 PSUs
To
focus management’s efforts on the achievement of increases in net cash flows (defined as net cash generated by the Company’s
continuing activities, minus capital expenditures and capitalized software costs), during the three years ending June 30, 2022
and 2021, (the “Performance Periods”), in fiscal 2020 and 2019, the Compensation Committee granted 51,905 and 89,542
PSUs (at maximum) to LTIP Participants. Provisional vesting of the PSUs was made contingent on the achievement of net cash flows
on an annual basis with final vesting, subject to possible upward or downward adjustment of 20% of the PSUs, based on a comparison
of the Company’s total shareholder return (“TSR”) for the three year Performance Period, to the TSR of the Russell
2000 Index, for the same Performance Period. Threshold, target and maximum net cash flow goals were established for fiscal 2020
and 2019 and grant dates were established for that year’s PSUs, for expense recognition purposes. In fiscal 2019 and 2020,
the Company achieved the maximum net cash flows performance under the targets established for those years and as a result 14,426
and 49,121 shares are provisionally vested under the fiscal 2020 and 2019 LTIP, respectively.
For
any of the PSUs to fully vest, a Participant must provide continuous service through the end of the respective three year Performance
Periods. Stock-based compensation expense of $610,000 and $80,000 was recognized in fiscal 2020 and 2019, respectively, for these
PSUs, and such expense includes an estimate for the Company’s expected TSR performance as compared to the Russell 2000 Index,
over the respective performance periods to date.
Fiscal
2018 PSUs
Through
June 30, 2020 no stock-based compensation expense was recognized for 30,370 2018 PSUs awards, as the 2018 Performance Goal was
not achieved, and those shares were forfeited as of June 30, 2020.
The
net cash flows goals for fiscal years 2021 and 2022 will be set in those fiscal years, which will give rise to grant dates for
expense recognition purposes.
2013
LTIP Awards
As
previously reported, based on the financial results achieved in fiscal 2017, the Company achieved the maximum performance goal
under the 2013 LTIP, in fiscal 2017. Therefore, in accordance with the terms of the 2013 LTIP, the remaining 50% of the 2013 LTIP
shares vested on June 30, 2018. Stock-based compensation expense recognized for those shares was approximately $503,000, in fiscal
2018. There was no compensation expense required to be recognized under the 2013 LTIP in fiscal 2020 and 2019.
Non-Employee
Director Award
In
each of fiscal years 2020, 2019, and 2018, each of our non-employee directors was granted restricted service-based shares with
grant date fair values of $45,000, for a total fair value of $180,000 in both fiscal 2020, and fiscal 2019, and $315,000 in fiscal
2018. Those shares have a one year vesting period, coinciding with the directors’ service period and the shares vest 25%
on a quarterly basis.
CEO
Awards
On
March 16, 2020, the Company granted Mr. Orlando, the Company’s CEO, a total of 32,278 restricted shares, comprising 16,139
service-based RSUs and 16,139 performance-based PSUs.
The
RSUs vest in three equal annual installments on March 16, 2021, 2022, and 2023, respectively.
The
PSUs vest in three equal installments based on the annual revenue performance of the business in fiscal years ending June 30,
2020, 2021 and 2022, respectively. The 16,139 PSUs referenced above represent the number of shares that can be earned at target.
If maximum performance is achieved, an additional 25% of that year’s PSUs will be earned. Threshold, target and maximum
revenue goals were established by the Compensation Committee of the Board of Directors for fiscal 2020. Based on the revenue generated
by the Company in fiscal 2020, a determination was made by the Compensation Committee that one-third of the PSUs or 5,379 had
vested. Threshold, target and maximum performance goals will be established for the fiscal years 2021 and 2022 PSUs in those respective
years, which will give rise to grant dates for expense recognition purposes.
Stock-based
compensation expense related to these grants was $108,000 in fiscal 2020.
Other
Service-Based Awards
In
each of fiscal 2019 and 2018 the Company granted to other employees 5,000 service-based restricted shares, with grant date fair
values of $111,000 and $83,000 respectively, and with vesting periods of four years.
Total
Expense
Total
stock-based compensation expense recognized for all restricted share awards was $1,575,000, $974,000, and $1,421,000, in fiscal
years ended June 30, 2020, 2019, and 2018, respectively. See Results of Operations: Stock-Based Compensation Expense below
for additional information on stock-based compensation expense.
Capitalized
Software. In fiscal years 2020, 2019, and 2018, we capitalized approximately $1,330,000, $1,055,000, and $911,000, respectively,
of software development costs related to a number of in-house software development projects. GAAP requires that certain software
development costs incurred, either from internal or external sources, be capitalized as part of intangible assets and amortized
on a straight-line basis over the useful life of the software, which we have estimated at
three years. On the other hand, planning, training, support and maintenance costs incurred either prior to or following
the implementation phase of a software development project are recognized as expense in the periods in which they are incurred.
During the fiscal years ended June 30, 2020, 2019, and 2018, we recorded approximately $1,039,000, $892,000, and $701,000, respectively,
as amortization expense related to such capitalized software projects.
We
evaluate the carrying values of capitalized software to determine whether those values are impaired and, if necessary, we record
an impairment charge in the period in which we
determine that an impairment has occurred.
Income
Taxes, Deferred Tax Assets and Valuation Allowances. We account for income taxes in accordance with GAAP, which requires the
recording of deferred tax assets and liabilities for the future consequences of events that have been recognized in the Company’s
financial statements or tax returns or for uncertain tax positions. Measurement of the deferred items is based on enacted tax
laws. In the event the future consequences of differences between financial reporting bases and tax bases of the Company’s
assets or liabilities result in a deferred tax asset, GAAP requires that we evaluate the probability of realizing the future income
tax benefits comprising that asset based on a number of factors, which include projections of future taxable income and the nature
of the tax benefits and the respective expiration dates of tax credits and net operating losses. As the Company has been generating
taxable income in the United States, we have concluded that it is more likely than not, that we will realize our U.S. deferred
tax assets. However, we have established valuation allowances against the deferred tax assets of our Hong Kong, Japan and China
subsidiaries and our France branch, due to losses incurred, which makes it uncertain that we will realize the benefits from those
deferred tax assets in future periods.
The
income tax provisions of $3,409,000, $4,148,000, and $2,760,000, in fiscal 2020, 2019 and 2018, respectively, represented annual
effective tax rates (“ETRs”), of approximately 24%, 29%, and 31%, respectively. The ETR for 2020 and 2019 reflects
a federal tax rate of 21%, as a result of the 2017 Tax Cuts and Jobs Act (“Tax Act”) enacted into law in December
2017. The ETR in fiscal 2020 benefited from the release of valuation allowances in China whereas in fiscal 2019 a non-cash valuation
allowance was established against our deferred tax assets in China which represented about 4% of the ETR of 29%. In fiscal 2018,
a blended federal tax rate of approximately 28% applied as the Tax Act only applied for the second half of the year. The provisions
for each year were adjusted for excess tax benefits or deficiencies related to the vesting of restricted shares.
See
note 8 to the Consolidated Financial Statements included elsewhere in this report which discusses the Tax Act in more detail.
Results
of Operations
See
Recent Developments: Coronavirus (COVID-19) in conjunction with the following discussions:
The
following table sets forth certain financial data, expressed as a percentage of net revenues, derived from our Consolidated Statements
of Operations for the respective periods indicated below:
| Fiscal Year Ended June 30, |
||||||||||||
| 2020 | 2019 | 2018 | ||||||||||
| Net revenues | 100.0 | % | 100.0 | % | 100.0 | % | ||||||
| Cost of revenues | 42.7 | % | 41.6 | % | 43.1 | % | ||||||
| Gross profit | 57.3 | % | 58.4 | % | 56.9 | % | ||||||
| Operating expenses: | ||||||||||||
| Selling and marketing expenses |
11.9 | % | 14.3 | % | 14.8 | % | ||||||
| General & administrative expenses |
26.9 | % | 24.3 | % | 29.0 | % | ||||||
| Impairment Charge |
0.6 | % | – | – | ||||||||
| Total operating expenses |
39.4 | % | 38.6 | % | 43.8 | % | ||||||
| Operating income | 17.9 | % | 19.8 | % | 13.1 | % | ||||||
| Interest and other income (expense), net |
0.1 | % | (0.3 | )% | (0.1 | )% | ||||||
| Income before provision for income taxes | 18.0 | % | 19.5 | % | 13.0 | % | ||||||
| Provision for income taxes |
4.3 | % | 5.7 | % | 4.0 | % | ||||||
| Income from continuing operations | 13.7 | % | 13.8 | % | 9.0 | % | ||||||
| Income from discontinued operations |
– | – | 0.1 | % | ||||||||
| Net income |
13.7 | % | 13.8 | % | 9.1 | % | ||||||
Net
Revenues. Net revenues consist primarily of fees that we generate from the authentication and grading of collectibles, including
coins, trading cards and autographs and related special inserts, if applicable. To a lesser extent, we generate collectibles related
service revenues (which we refer to as “other related revenues”) from advertising and affiliate program commissions
earned from our websites and in printed publications; subscription/membership revenues from CCE, and Collectors Club; and fees
generated from promoting, managing and operating our Expos tradeshow events. We also generate revenues from product sales, (primarily
coins that we purchase under our warranty policy); however, they are not considered to be the focus of or an integral part of
our ongoing revenue generating activities).
The
following tables set forth the total net revenues for the fiscal years ended June 30, 2020, 2019 and 2018 between authentication
and grading services revenues and other related services (in thousands):
| 2020 vs. 2019 |
||||||||||||||||||||||||
| 2020 | 2019 | Increase (Decrease) |
||||||||||||||||||||||
|
Amount |
% of Net Revenues |
Amount | % of Net Revenues |
Amount | Percent | |||||||||||||||||||
| Authentication and grading fees |
$ | 71,069 | 90.1 | % | $ | 63,790 | 88.0 | % | $ | 7,279 | 11.4 | % | ||||||||||||
| Other related revenues | 7,822 | 9.9 | % | 8,663 | 12.0 | % | (841 | ) | (9.7 | )% | ||||||||||||||
| Total revenues | $ | 78,891 | 100.0 | % | $ | 72,453 | 100.0 | % | $ | 6,438 | 8.9 | % | ||||||||||||
| 2019 vs. 2018 |
||||||||||||||||||||||||
| 2019 | 2018 | Increase (Decrease) |
||||||||||||||||||||||
|
Amount |
% of Net Revenues |
Amount |
% of Net Revenues |
Amount | Percent | |||||||||||||||||||
| Authentication and grading fees |
$ | 63,790 | 88.0 | % | $ | 60,076 | 87.8 | % | $ | 3,714 | 6.2 | % | ||||||||||||
| Other related revenues |
8,663 | 12.0 | % | 8,373 | 12.2 | % | 290 | 3.5 | % | |||||||||||||||
| Total revenues |
$ | 72,453 | 100.0 | % | $ | 68,449 | 100.0 | % | $ | 4,004 | 5.8 | % | ||||||||||||
The
following tables set forth certain information regarding the increases or decreases in net revenues from our larger markets (which
are inclusive of revenues from our other related services) in each of the periods presented below (in thousands):
| 2020 | 2019 | 2020 vs. 2019 |
||||||||||||||||||||||
| % of Net |
% of Net |
Increase (Decrease) |
||||||||||||||||||||||
| Coins: | Amount | Revenues | Amount | Revenues | Amounts | % | ||||||||||||||||||
| United States | $ | 33,563 | 42.5 | % | $ | 33,860 | 46.7 | % | $ | (297 | ) | (0.9 | )% | |||||||||||
| China | 5,208 | 6.6 | % | 4,186 | 5.8 | % | 1,022 | 24.4 | % | |||||||||||||||
| France & Hong Kong |
2,828 | 3.6 | % | 3,348 | 4.6 | % | (520 | ) | (15.5) | % | ||||||||||||||
| Total Coins | 41,599 | 52.7 | % | 41,394 | 57.1 | % | 205 | 0.5 | % | |||||||||||||||
| Cards and autographs (1) |
33,673 | 42.7 | % | 26,420 | 36.5 | % | 7,253 | 27.5 | % | |||||||||||||||
| Other (2) |
3,619 | 4.6 | % | 4,639 | 6.4 | % | (1,020 | ) | (22.0 | )% | ||||||||||||||
| $ | 78,891 | 100.0 | % | $ | 72,453 | 100.0 | % | $ | 6,438 | 8.9 | % | |||||||||||||
| 2019 | 2018 | 2019 vs. 2018 |
||||||||||||||||||||||
| % of Net |
% of Net |
Increase (Decrease) |
||||||||||||||||||||||
| Coins: | Amount | Revenues | Amount | Revenues | Amounts | % | ||||||||||||||||||
| United States | $ | 33,860 | 46.7 | % | $ | 31,693 | 46.3 | % | $ | 2,167 | 6.8 | % | ||||||||||||
| China | 4,186 | 5.8 | % | 7,663 | 11.2 | % | (3,477 | ) | (45.4 | )% | ||||||||||||||
| France & Hong Kong |
3,348 | 4.6 | % | 3,481 | 5.1 | % | (133 | ) | (3.8 | )% | ||||||||||||||
| Total Coins | 41,394 | 57.1 | % | 42,837 | 62.6 | % | (1,443 | ) | (3.4 | )% | ||||||||||||||
| Cards and autographs (1) |
26,420 | 36.5 | % | 21,065 | 30.8 | % | 5,355 | 25.4 | % | |||||||||||||||
| Other (2) |
4,639 | 6.4 | % | 4,547 | 6.6 | % | 92 | 2.0 | % | |||||||||||||||
| $ | 72,453 | 100.0 | % | $ | 68,449 | 100.0 | % | $ | 4,004 | 5.8 | % | |||||||||||||
| (1) | Consists of revenues from our PSA trading card authentication and grading business (including Japan) and our PSA/DNA autograph authentication and grading business. |
|
| (2) | Includes the revenues generated by our CCE subscription business, Coinflation.com, Collectors.com, the Expos trade show and product sales. |
Fiscal
2020 vs. 2019. In fiscal 2020, our total service revenues increased by $6,438,000, or 8.9%, to a record $78,891,000, from
$72,453,000 in 2019. That increase was primarily attributable to an increase of $7,279,000, or 11.4%, in authentication and grading
fees, partially offset by lower other related revenues of $841,000. The increased authentication and grading fees were comprised
of an increase of $7,067,000, or 28.8%, in cards / autographs and an increase of $212,000, or 0.5%, in coin fees, as discussed
in more detail below. The lower other related revenues in fiscal 2020, as compared to fiscal 2019, was primarily due to the cancellation
of an Expos trade show in the fourth quarter of fiscal 2020 and lower product sales.
Despite
the impact of COVID-19 primarily in the month of April 2020, the Company generated record quarterly revenues of $20,502,000 in
its fourth quarter of fiscal 2020 as compared to $19,784,000 in the fourth quarter of fiscal 2019, driven by an increase of 27%
in our cards and autograph revenue.
Revenues
from our trading cards / autographs business continued to show consistent growth in fiscal 2020, although that revenue growth
was curtailed somewhat by COVID-19, primarily in the months of March and April 2020. Those revenues increased by 27.5% in fiscal
year 2020 and represented record revenues for that business. Moreover, our card and autographs business has achieved quarter-over-quarter
revenue growth in 39 of the last 40 quarters.
The
increased revenues from China in fiscal 2020, reflected an improved revenue performance in our China business in the first half
of fiscal 2020 prior to the outbreak of COVID-19. As discussed under Recent Developments: Coronavirus COVID-19 above, we
expect there will be slower revenue growth in China, while travel restrictions continue between the U.S. and China.
Changes
in U.S. Coin fees include increases of (i) $1,181,000 in U.S. modern coin revenues, primarily reflecting increased revenues in
the fourth quarter of fiscal 2020 from the Emergency Issue Silver Program from the U.S. Mint and (ii) higher vintage coin revenues
of $1,125,000, reflecting revenues earned in this year’s second quarter from the authentication and grading of a large customer
collection and in the fourth quarter from redirecting what would have been show submissions to our California facility for authentication
and grading. Those increases were mostly offset by lower trade show revenues, related to the cancellation of coin shows in the
third and fourth quarters of fiscal 2020 due to COVID-19, and one less show and lower average per show submissions in the first
half of the year.
Our
coin and cards and autographs authentication and grading businesses represented approximately 95% of total revenues in fiscal
2020, reflecting the continued importance of those two businesses to our overall financial performance.
For
the reasons discussed above under “Factors That Can Affect our Revenues”, and “Impact of Economic Conditions
on our Financial Performance”, the level of coin service revenues can be volatile. Our U.S. coin revenue in fiscal 2020
was substantially the same as 2019, despite COVID-19 and we will continue our efforts to identify and take advantage of revenue
opportunities in that business.
With
respect to our cards and autographs business, which ended fiscal 2020 with a record backlog of cards to be authenticated and graded,
we expect continued growth in that business in fiscal 2021 as we continue to increase authentication and grading operations capacity.
With
respect to China, we will continue to focus on growing that business, which finished fiscal 2020 with a relatively high backlog
and we will be focused on making that business less reliant on our U.S. personnel to offset travel restrictions between the U.S.
and China.
Fiscal
2019 vs. 2018. In fiscal 2019, our total revenues increased by $4,004,000 or 5.8%, to a then annual record of $72,453,000
from $68,449,000 in fiscal 2018. That increase was attributable to an increase of $3,714,000, or 6.2%, in authentication and grading
fees, and a $290,000, or 3.5%, increase in other related services. The increase in authentication and grading fees was attributable
to an increase of $5,241,000, or 27.1%, in cards and autograph fees partially offset by a net decrease of $1,527,000 or 3.7%,
in coin fees, attributable to a decrease in fees generated in China (see below).
Revenues
from our trading cards and autographs business showed consistent growth. Those revenues increased by 25% in fiscal 2019 and represented
record annual revenues for that business through fiscal 2019.
The
decreased revenues in China in fiscal 2019, represented a reduction of revenues from the banking channel in China of approximately
$4.0 million in fiscal 2019 as compared to fiscal 2018. We generated non-banking channel revenues in China of $4,115,000 in fiscal
2019, as compared to $3,598,000 in fiscal 2018, representing an annual increase of 14% in fiscal 2019, which included a 42% increase
in the fourth quarter of fiscal 2019.
The
increase in U.S. coin fees in fiscal 2019 compared to the prior year, primarily reflected, (i) higher show fees of $1,852,000
or 33%, reflecting higher average fees earned per show in fiscal 2019 (ii) higher modern coin fees of $452,000 or 4%, which included
a stronger second half of the year and was inclusive of the Apollo program primarily in this year’s third quarter and (iii)
lower U.S. vintage fees of $241,000 or 1.9%, due to a decrease in submissions in the second half of fiscal 2019.
Gross
Profit
Gross
profit is calculated by subtracting the cost of revenues from net revenues. Gross profit margin is gross profit stated as a percentage
of net revenues. The costs of authentication and grading revenues consist primarily of labor to authenticate and grade collectibles,
production costs, credit card fees, warranty expense, occupancy, security and insurance costs that directly relate to providing
authentication and grading services. Cost of revenues also includes printing, other direct costs of the revenues generated by
our other non-grading related services and the costs of product sales (which represent the carrying value of the inventory of
products, that are primarily collectible coins that we sold) and any inventory-related reserves on our consumable inventory and
coins, that may be considered necessary.
Set
forth below is information regarding our gross profit and gross profit margins in the fiscal years ended June 30, 2020, 2019 and
2018 (in thousands):
| Fiscal Year Ended June 30, |
||||||||||||
| 2020 | 2019 | 2018 | ||||||||||
| Gross profit |
$ | 45,236 | $ | 42,300 | $ | 38,978 | ||||||
| Gross profit margin |
57.3 | % | 58.4 | % | 56.9 | % | ||||||
Fiscal
2020 vs. 2019. As indicated in the above table, our gross profit margin was 57.3% in fiscal 2020, as compared to 58.4% in
fiscal 2019. The gross profit margin in fiscal 2020, reflects the adverse effects of COVID-19, including our decision to continue
paying all personnel through March 31, 2020, despite the closures of our businesses during that quarter. The gross profit margin
in the fourth quarter of fiscal 2020 was 59.8% as compared to 58.7% in the fourth quarter of fiscal 2019, despite the COVID-19
disruption, primarily in April 2020. The gross profit margin for coins was consistent in fiscal 2020 as compared to fiscal 2019.
The gross profit margin for our cards and autographs business was down in fiscal 2020 as compared to fiscal 2019 and reflects
continued costs incurred to increase capacity to address the record backlog in that business. As previously reported, there can
be on-going variability in the gross profit margin due to the mix of revenue and the seasonality of our business. During the three
years ended June 30, 2020, our quarterly gross profit margins varied between 53% and 62%.
Fiscal
2019 vs. 2018. As indicated in the above table, our gross profit margin was 58.4% and 56.9% in fiscal, 2019 and 2018, respectively.
The higher gross profit margin earned in fiscal 2019, reflects an improved gross profit margin earned on our coin and cards and
autograph businesses, primarily due to higher average service fees in those businesses, (due to the mix of collectibles authenticated
and graded and also higher fees charged for certain services) and in the case of cards and autographs a higher number of units
authenticated and graded.
Selling
and Marketing Expenses
Selling
and marketing expenses are comprised primarily of advertising and promotions costs, trade-show expenses, customer service personnel
costs, business development salaries and incentive compensation costs, depreciation and third-party consulting costs.
The
following table sets forth selling and marketing expenses that we incurred in fiscals 2020, 2019 and 2018 (in thousands):
| Fiscal Year Ended June 30, |
||||||||||||
| 2020 | 2019 | 2018 | ||||||||||
| Selling and marketing expenses | $ | 9,436 | $ | 10,361 | $ | 10,137 | ||||||
| As a percentage of net revenues | 11.9 | % | 14.3 | % | 14.8 | % | ||||||
Fiscal
2020 vs. 2019. As indicated in the above table, selling and marketing expenses were 11.9% of revenues in the fiscal 2020,
as compared to 14.3% in the fiscal 2019. In absolute dollars, selling and marketing expenses in 2020 decreased by $925,000, primarily
as a result of cancellations of coin trade shows that had been scheduled to take place in the fourth quarter of fiscal 2020, due
to COVID-19 and lower coin business development costs at our overseas coin businesses. Those cost savings were partially offset
by higher sales and marketing expenses in our growing cards / autographs business.
Fiscal
2019 vs. 2018. As indicated in the above table, selling and marketing expenses represented 14.3% of revenues in fiscal 2019,
as compared to 14.8% in fiscal 2018. In absolute dollars, selling and marketing expenses increased by $224,000 or 2.2% in fiscal
2019 as compared with fiscal 2018. We incurred higher selling and marketing expenses in our growing cards and autograph business
(including costs incurred for business development activities in Japan for the Company’s new Japanese subsidiary), which
for the most part was offset by lower selling and marketing expenses in our other businesses.
General
and Administrative Expenses
General
and administrative (“G&A”) expenses are comprised primarily of compensation paid to general and administrative
personnel, including executive management, finance and accounting, information technology and, facilities management, depreciation,
amortization and other miscellaneous expenses. G&A expenses also include non-cash stock-based compensation costs, arising
from the grant or vesting of stock awards to general and administrative personnel and outside directors.
The
following table sets forth G&A expenses that we incurred in fiscals 2020, 2019 and 2018 (in thousands):
| Fiscal Year Ended June 30, |
||||||||||||
| 2020 | 2019 | 2018 | ||||||||||
| General & administrative expenses |
$ | 21,212 | $ | 17,597 | $ | 19,864 | ||||||
| As a percentage of net revenues | 26.9 | % | 24.3 | % | 29.0 | % | ||||||
Fiscal
2020 vs. 2019. As indicated in the above table, G&A expenses represented 26.9% of revenues in fiscal 2020, as compared
to 24.3% in fiscal 2019. The dollar increase in G&A expenses in fiscal 2020 of $3,615,000, included (i) higher payroll related
costs of $1,092,000 (which was inclusive of higher performance based incentive costs of $449,000 in connection with the improved
operating performance of the business, as certain of those incentive costs are based on an individual’s areas of responsibility),
(ii) higher legal expenses of $1,114,000, (of which $967,000 were related to pre-trial settlements), (iii) higher non-cash stock
based compensation of $642,000 in connection with the Company’s LTIP programs (see below) and (iv) higher consulting and
outside service costs of $392,000 (which are inclusive of costs incurred on improving our operational processes and productivity).
Fiscal
2019 vs. 2018. As indicated in the above table, G&A expenses decreased to 24.3% of revenues in fiscal 2019, from 29.0%
in fiscal 2018. In absolute dollars, G&A expenses decreased by $2,267,000 in fiscal 2019 due to (i) lower payroll and related
costs of $824,000 in fiscal 2019, arising from staff reductions implemented in the fourth quarter of fiscal 2018, and management
changes in the Company’s coin division that occurred in the first half of fiscal 2019, partially offset by increased management
incentives due to the improved performance of our businesses in fiscal 2019, as compared to fiscal 2018; (ii) the non-recurrence
in fiscal 2019 of $869,000, comprised of moving and lease exit costs, in connection with the Company’s new operations and
headquarter facility, and a pre-litigation net settlement that was incurred in fiscal 2018; (iii) lower non-cash stock based compensation
of $419,000 in fiscal 2019 (discussed below) and (iv) lower recruitment and travel costs of $315,000. Those reductions were partially
offset by higher depreciation expense of $279,000, primarily related to depreciation of tenant improvements and other assets capitalized
as part of our new operations and headquarters facility and higher amortization of capitalized software projects of $193,000 this
year.
Stock-Based
Compensation Expense
We
recognize non-cash stock-based compensation expense that is attributable to grants or the vesting of restricted stock. Stock-based
compensation expense is recorded as part of (i) sales and marketing expenses, in the case of stock awards granted to employees
whose compensation is classified as sales and marketing expenses and (ii) general and administrative expenses, in the case of
stock awards granted to directors, executive and financial management and administrative personnel.
The
following table sets forth the stock-based compensation expense we recognized in fiscal 2020, 2019 and 2018 (in thousands):
| Fiscal Year Ended June 30, |
||||||||||||
| Included In: | 2020 | 2019 | 2018 | |||||||||
| Sales and marketing | $ | 29 | $ | 70 | $ | 98 | ||||||
| General and administrative expenses |
1,546 | 904 | 1,323 | |||||||||
| $ | 1,575 | $ | 974 | $ | 1,421 | |||||||
The
related tax benefit recognized for stock-based compensation expense was approximately $418,000, $254,000 and $1,035,000 in fiscals
2020, 2019 and 2018, respectively.
For
PSUs that are contingent on the achievement of financial performance goals for vesting to occur, the amount of stock-based compensation
recognized in any period can vary depending on an assessment as to whether it has become probable that the Company will achieve
the performance goals and the time periods in which those goals are expected to be achieved. If it becomes probable that a performance
goal will be achieved, there can be catch-up of stock-based compensation expense in that period, reflecting the additional expense
required to be recognized from the service inception date through the period when it became probable that the goal would be achieved.
Thereafter, stock-based compensation expense for the performance goal is recognized over the expected remaining service period
to vesting.
Stock-based
compensation expense related to financial performance goals was $693,000, $80,000 and $503,000 in fiscal 2020, 2019 and 2018,
respectively. The increased expense in fiscal 2020, as compared to fiscal 2019, reflects the achievement of the maximum net cash
performance goals for those years in both fiscal 2019 and 2020, with the associated expense recognized over the performance period.
A
total of $1,935,000 of stock-based compensation expense for unvested restricted stock awards remained unrecognized as of June
30, 2020, based on the assumption that the holders of those awards would remain in the Company’s service through fiscal
2023. That expense will be recognized in future periods, as follows (in thousands):
| Year Ending June 30, |
|||||
| 2021 | $ | 1,321 | |||
| 2022 | 530 | ||||
| 2023 | 84 | ||||
| Total | $ | 1,935 | |||
The
$1,935,000 of unrecognized expense does not include any expense that may arise from (i) grants of any additional restricted stock
awards in future periods, (ii) the PSUs granted under the 2020 and 2019 LTIPs for which grant dates are to be established in fiscal
2021 and 2022.
Impairment
Charge
|
Fiscal (in |
||||||||||||
| 2020 | 2019 | 2018 | ||||||||||
| Impairment Charge | $ | 486 | $ | – | $ | – | ||||||
The
impairment charge of $486,000 in fiscal 2020 relates to our Expos business and as discussed above under Recent Developments:
Coronavirus (COVID-19), there continues to be uncertainty as to the viability of the Expos trade show business, due to COVID-19
that resulted in the cancellation of shows and due to expected social distancing concerns that will limit the numbers of dealers
and attendees at future shows.
Interest
Income, Net
Interest
income is generated on cash balances that we have invested, primarily in highly liquid money market accounts and funds. Interest
expense consists of interest incurred on outstanding borrowings, loan arrangement fees and unused commitment fees on credit facilities.
The following table compares the net interest income (expense) in the fiscal years ended June 30, 2020, 2019 and 2018, (in thousands):
| Fiscal Year Ended June 30, |
||||||||||||
| 2020 | 2019 | 2018 | ||||||||||
| Interest income (expense), net |
$ | 78 | $ | (69 | ) | $ | (114 | ) | ||||
Due
to the Company maintaining higher cash balances and higher prevailing interest rates through February 2020, interest income was
$213,000 in fiscal 2020, as compared to $111,000 and $19,000 in fiscal 2019 and 2018, respectively. Interest expense of $135,000,
$180,000 and $133,000 was recognized in fiscal 2020, 2019 and 2018, respectively. Interest expense in fiscal 2020, 2019 and 2018,
primarily related to borrowings under the Company’s term loan and commitment fees incurred under the revolving line of credit.
Provision
for Income Taxes
|
Fiscal (in |
||||||||||||
| 2020 | 2019 | 2018 | ||||||||||
| Provision for income taxes | $ | 3,409 | $ | 4,148 | $ | 2,760 | ||||||
The
income tax provisions of $3,409,000, $4,148,000, and $2,760,000, in fiscals 2020, 2019 and 2018, respectively, represented ETRs,
of approximately 24%, 29%, and 31%, respectively. The ETR for 2020 and 2019 reflect a federal tax rate of 21%, as a result of
the Tax Act enacted into law in December 2017. The ETR in fiscal 2020 benefited from the release of valuation allowances in China,
whereas in fiscal 2019 a non-cash valuation allowance was established against our deferred tax assets in China and represented
about 4% of the ETR of 29%. In fiscal 2018, a blended federal tax rate of approximately 28% applied as the Tax Act only applied
for the second half of that year. The income tax provisions for each fiscal year were adjusted for excess tax benefits or deficiencies
related to the vesting of restricted shares.
Discontinued
Operations
|
Fiscal (in |
||||||||||||
| 2020 | 2019 | 2018 | ||||||||||
| Income from discontinued operations, (net of income taxes) |
$ | – | $ | – | $ | 104 | ||||||
The
income from discontinued operations (net of income taxes), reflected pre-tax accretion expenses of $2,000 in fiscal year 2018,
recognized in connection with the facilities, formerly occupied by our discontinued jewelry businesses and the write-off of all
remaining discontinued balances as of March 31, 2018.
Quarterly
Results of Operations
Generally,
the revenues generated by our collectibles grading and authentication businesses are lower during our second quarter, which ends
on December 31, than in other quarterly periods, because collectibles commerce generally decreases during the holiday season.
As discussed under “Factors that can Affect Operating Results and our Financial Position” and “Trends in
our Businesses” above there can be period to period variability in coin revenues due to general market conditions that
will impact the level of coin revenues in a given quarter, and the level of U.S. modern coin revenues, which are typically higher
in our third quarter.
Prior
to the onset of COVID-19, our collectibles trade show business added to the variability in our quarter-to-quarter operating results,
because its revenues can vary based on the timing of the collectibles trade shows. Historically, the revenues of this business
were higher in the first, third and fourth quarters of our fiscal years, compared to the second quarter, because the Long Beach,
California Collectibles Shows took place during the first, third and fourth quarters. See also Recent Developments-Coronavirus
(COVID-19) above, which discusses the impact of COVID-19 on our quarterly operating results in fiscal 2020 and may have in
future quarters.
The
tables below present unaudited selected quarterly financial data for each of the eight quarters beginning September 30, 2018 and
ending on June 30, 2020. The information has been derived from our unaudited quarterly condensed consolidated financial statements,
which have been prepared on a basis consistent with our audited Consolidated Financial Statements appearing in ITEM 8 of this
Annual Report. The consolidated financial information set forth below includes all adjustments (consisting of normal adjustments
and accruals) that we consider necessary for a fair presentation of the unaudited quarterly results when read in conjunction with
the Consolidated Financial Statements and the notes thereto appearing elsewhere in ITEM 8 of this Annual Report. These quarterly
operating results are not necessarily indicative of results that may be expected for any subsequent fiscal periods.
|
Quarterly |
Quarter (In |
|||||||||||||||||||||||||||||||
|
Sept. 2018 |
Dec.31, 2018 |
Mar.31, 2019 |
June 30, 2019 |
Sept. 30, 2019 |
Dec. 31, 2019 |
Mar. 31, 2020 |
June 30, 2020 |
|||||||||||||||||||||||||
| Statement of Operations Data: | ||||||||||||||||||||||||||||||||
| Net revenues | $ | 17,495 | $ | 15,704 | $ | 19,471 | $ | 19,783 | $ | 20,210 | $ | 19,456 | $ | 18,723 | $ | 20,502 | ||||||||||||||||
| Cost of revenue | 7,202 | 6,953 | 7,827 | 8,171 | 8,101 | 8,533 | 8,771 | 8,250 | ||||||||||||||||||||||||
| Gross profit | 10,293 | 8,751 | 11,644 | 11,612 | 12,109 | 10,923 | 9,952 | 12,252 | ||||||||||||||||||||||||
| Operating Expenses: | ||||||||||||||||||||||||||||||||
| SG&A expense(i) |
7,466 | 6,537 | 6,879 | 7,076 | 7,472 | 7,649 | 7,310 | 8,217 | ||||||||||||||||||||||||
| Impairment Charge(ii) |
– | – | – | – | – | – | – | 486 | ||||||||||||||||||||||||
| Operating income | 2,827 | 2,214 | 4,765 | 4,536 | 4,637 | 3,274 | 2,642 | 3,549 | ||||||||||||||||||||||||
| Interest and other income (expense), net |
3 | (145 | ) | (4 | ) | (71 | ) | 71 | 4 | 38 | (20 | ) | ||||||||||||||||||||
| Income before provision for income taxes | 2,830 | 2,069 | 4,761 | 4,465 | 4,708 | 3,278 | 2,680 | 3,529 | ||||||||||||||||||||||||
| Provision for income taxes (iii) |
699 | 588 | 1,202 | 1,659 | 1,095 | 664 | 753 | 897 | ||||||||||||||||||||||||
| Net Income | $ | 2,131 | $ | 1,481 | $ | 3,559 | $ | 2,806 | $ | 3,613 | $ | 2,614 | $ | 1,927 | $ | 2,632 | ||||||||||||||||
| Net income per share: | ||||||||||||||||||||||||||||||||
| Basic | $ | 0.24 | $ | 0.17 | $ | 0.40 | $ | 0.31 | $ | 0.40 | $ | 0.29 | $ | 0.21 | $ | 0.29 | ||||||||||||||||
| Diluted | $ | 0.24 | $ | 0.17 | $ | 0.40 | $ | 0.31 | $ | 0.40 | $ | 0.29 | $ | 0.21 | $ | 0.29 | ||||||||||||||||
| Weighted average shares outstanding: | ||||||||||||||||||||||||||||||||
| Basic | 8,933 | 8,936 | 8,938 | 8,943 | 8,973 | 8,980 | 8,989 | 8,993 | ||||||||||||||||||||||||
| Diluted | 8,962 | 8,947 | 8,966 | 9,004 | 9,060 | 9,061 | 9,073 | 9,078 | ||||||||||||||||||||||||
| (i) | In the fourth quarter of fiscal 2020, the Company recognized approximately $845,000 of pre-trial litigation costs that are included in SG&A expense in that quarter. |
|
| (ii) | The impairment reserve in the fourth quarter of fiscal 2020 related to our Expos tradeshow business. See Recent Developments-Coronavirus (COVID-19) above. |
|
| (iii) | The higher ETR in the fourth quarter of fiscal 2019, reflects a non-cash valuation allowance established against deferred tax assets in China as of June 30, 2019. See Provisions for Income Taxes above. |
Liquidity
and Capital Resources
See
Recent Developments: Coronavirus (COVID-19) in conjunction with the discussion below:
Cash
and Cash Equivalent Balances. At June 30, 2020, we had cash and cash equivalent balances of $28,640,000 as compared to $19,225,000
at June 30, 2019 and $10,581,000 at June 30, 2018.
Historically,
we have been able to rely on internally generated funds, rather than borrowings, as our primary source of funds to support our
continuing grading operations, because many of our authentication and grading customers prepay our fees at the time they submit
their collectibles to us for authentication and grading or prior to the shipment of the collectible back to them. In March 2020,
we increased our $10 million revolving unsecured bank line of credit to $15 million and extended the term by two years through
March 2022. There were no borrowings under the line of credit in fiscal 2020. Additionally, in September 2017, we obtained the
$3.5 million Term Loan, under which we borrowed $3.0 million, to fund capital expenditures, moving costs and lease exit costs,
in connection with our move to our new operations and headquarters facility. See below.
Cash
Flows
Cash
Flows from Operating Activities. In the fiscal years ended June 30, 2020, 2019, and 2018, our operating activities generated
cash of $19,166,000, $17,530,000, and $11,872,000, respectively. The increase in cash generated from operating activities in fiscal
2020 as compared to 2019 primarily reflects changes in working capital and higher non-cash expenses in fiscal 2020 as operating
income was about the same in both years. The increased cash generated from operating income in fiscal 2019 as compared to 2018,
reflected higher operating income in fiscal 2019, as adjusted for non-cash expenses and changes in working capital.
Cash
Flows of Discontinued Operations. In the fiscal years ended June 30, 2019, and 2018 discontinued operations used cash of $10,000,
and $215,000, respectively, related primarily to the payment of obligations for our discontinued jewelry businesses facilities,
which were fully satisfied during fiscal 2018.
Cash
Used in Investing Activities. In the fiscal years ended June 30, 2020, 2019, and 2018, investing activities used net cash
of $2,701,000, $1,834,000, and $4,819,000, respectively. The higher cash used in investing activities in fiscal 2018, related
to the buildout of the Company’s new operations and headquarters facility, which resulted in lower capital expenditures
required in fiscal 2019.
Cash
Used in Financing Activities. In the fiscal years ended June 30, 2020, 2019 and 2018, financing activities used net cash of
$7,050,000, $7,042,000 and $6,083,000, respectively. The Company borrowed $3,000,000 under its term loan in fiscal 2018 whereas
the Company made principal repayments under that loan of $750,000 and $563,000 in fiscal 2020 and 2019, respectively. Dividends
paid to stockholders were $6,300,000, $6,479,000 and $9,083,000 in fiscal 2020, 2019 and 2018, respectively. The lower dividend
payments in 2020 and 2019, reflect a decrease in the Company’s cash dividend rate implemented in the third quarter of fiscal
2018. (See Dividends below).
Overall,
the Company generated cash of $9,415,000, $8,644,000 and $755,000 in fiscal 2020, 2019 and 2018, respectively.
Outstanding
Financial Obligations
Lease
Obligations
On
February 3, 2017, the Company, as tenant, entered into a triple net lease pursuant to which the Company is leasing approximately
62,755 rentable square feet of space for its operations and headquarters facility. The term of this lease is 10 years and 10 months,
which commenced on the completion of tenant improvements, which was December 1, 2017. The Company received an abatement of the
monthly rent for the period from January 1, 2018 through October 31, 2018. The landlord contributed approximately $2.9 million
to the tenant improvements. At June 30, 2020 aggregate minimum obligations over the remaining term of the lease were approximately
$12.0 million.
We
also lease smaller offices for our overseas operations including a five year lease for our Shanghai office that commenced in November
2017, with aggregate minimum obligations over the term of the lease of approximately $3.0 million and a three year lease for our
offices Hong Kong, which commenced in July 2018, with aggregate minimum obligations over the term of that lease of approximately
$625,000.
At
June 30, 2020, future minimum lease payments under the lease agreements associated with our operations were as follows (in thousands):
|
Year |
Gross Amount |
||||
| 2021 | $ | 2,514 | |||
| 2022 | 2,138 | ||||
| 2023 | 1,663 | ||||
| 2024 | 1,473 | ||||
| 2025 | 1,470 | ||||
| Thereafter | 5,069 | ||||
| $ | 14,327 | ||||
Term
Loan. As previously reported, on September 15, 2017 the Company obtained a five-year, $3,500,000 unsecured term loan
from a commercial bank. The Company borrowed $3,000,000 under this loan to fund the Company’s share of the construction
and related facility costs for its new operations and headquarter facility, as well as its moving costs, and lease exit costs
for its former operations and headquarters facility. During that first year the Company was only required to make monthly payments
of interest on the borrowings.
In
September 2018, the loan balance outstanding was automatically converted into a four-year term loan in the principal amount of
the borrowings then outstanding, which was $3,000,000. In October 2018, the Company began repaying the loan in 48 equal monthly
principal payments of $62,500 or $750,000 on an annual basis, through September 2022. There are no prepayment penalties on loan
repayments, as the Company chose a 90-day LIBOR rate to apply to the outstanding balance upon conversion to the four-year term
loan.
The
agreement governing the term loan contains two financial covenants, which require the Company to maintain (a) a funded debt coverage
ratio and (b) a debt service coverage ratio, respectively. The loan agreement also contains certain other covenants typical for
this type of loan, including a covenant which provides that, without the bank’s consent, the Company may not incur additional
indebtedness for borrowed money, except for (i) borrowings under the Company’s revolving credit line, (see below) (ii) purchase
money indebtedness and (iii) capitalized lease obligations.
At
June 30, 2020, the Company had $1,688,000 of outstanding borrowings under this term loan, of which $750,000 was classified as
a current liability and $938,000 was classified as a long-term liability in the Consolidated Balance Sheet at June 30, 2020. The
Company was in compliance with the term loan covenants at June 30, 2020.
Revolving
Credit Line. On March 10, 2020 the Company amended and increased its $10 million unsecured revolving credit line (the “Credit
Line”) to $15 million and extended the term for two years through March 2022. The Company is entitled to obtain borrowings
at such times and in amounts as it may request, as supported by an EBITDA calculation for the last four quarters, provided that
the maximum principal amount of the borrowings that may be outstanding at any one time under the Credit Line may not exceed $15
million and each year there must be a period of 30 consecutive days during which no borrowings are outstanding. The Company also
may, at any time or from time to time and at its option, repay outstanding borrowings, in whole or in part, and may reborrow amounts
so repaid at such times and in such amounts as it deems appropriate.
Credit
Line borrowings will bear interest, at the Company’s option, at LIBOR plus 2.25% or at 0.25% below the highest prime lending
rate published from time to time by the Wall Street Journal. The Company is required to pay a quarterly unused commitment fee
of 0.0625% of the amount by which (if any) that the average of the borrowings outstanding under the Credit Line in any calendar
quarter is less than $6 million.
The
Credit Line agreement contains a financial covenant that requires the Company to maintain a funded debt coverage ratio, similar
to the debt coverage ratio that is applicable to the term loan and certain other covenants typical for this type of credit. At
June 30, 2020 the Company was in compliance with those covenants. Availability to borrow under the line of credit was $15,000,000
at June 30, 2020 however, there were no borrowings outstanding under the line of credit at June 30, 2020.
Dividends.
Effective the third quarter of fiscal 2018, our quarterly cash dividend was lowered to $0.175 per share from the $0.35 per share,
that had previously been in place since January 2015. As a result, we paid dividends of $6,300,000, $6,479,000, and $9,083,000,
in fiscal 2020, 2019, and 2018, respectively.
The
declaration and payment of cash dividends in the future, pursuant to the Company’s dividend policy, is subject to final
determination each quarter by the Board of Directors based on a number of factors, including the Company’s financial performance
and its available cash resources, its cash requirements and alternative uses of cash that the Board may conclude would represent
an opportunity to generate a greater return on investment for the Company and its stockholders. Accordingly, there is no assurance
that, in the future, the amount of the quarterly cash dividend will not be reduced or that the payment of dividends will not be
suspended or altogether discontinued.
Future
Uses of Cash.
We
plan to use our cash resources, consisting of available cash and cash equivalent balances, internally generated cash flows, and
borrowings under our revolving credit line, (i) to introduce new collectibles related services and initiatives for existing and
new customers (ii) to fund the expansion of our business (domestically and internationally); (iii) to fund capital expenditures,
and working capital requirements; (iv) to fund repayments under the Company’s term loan (v) to fund possible start-ups or
acquisitions of businesses, (vi) to pay cash dividends; and (vii) for other general corporate purposes.
Although
we have no current plans to do so, we also may seek additional borrowings and we may issue additional shares of our stock to finance
the growth and geographic expansion of our collectibles businesses. However, there is no assurance that we would be able to obtain
such additional borrowings or additional equity capital on terms acceptable to us, or at all.
Recent
Accounting Pronouncements
In
June 2016, the FASB issued Accounting Standards Update 2016-13, Financial Instruments-Credit Losses (Topic 326): Measurement
of Credit Losses on Financial Instrument. Subsequent to the issuance of ASU 2016-13, the FASB clarified the guidance through
several ASUs. The collective new guidance (ASC 326) generally requires entities to use a current expected credit loss model, which
is a new impairment model based on expected losses rather than incurred losses. Under this model, an entity would recognize an
impairment allowance equal to its current estimate of all contractual cash flows that the entity does not expect to collect. The
entity’s estimate would consider relevant information about past events, current conditions, and reasonable and supportable
forecasts. ASC 326 is effective for annual and interim fiscal reporting periods beginning after December 15, 2022, with early
adoption permitted for annual reporting periods beginning after December 15, 2018. The Company is continuing to evaluate the expected
impact of this ASC 326 but does not expect it to have a material impact on its consolidated financial statements upon adoption.
In
January 2017, the FASB issued ASU No. 2017-04, Intangibles-Goodwill and Other (Topic 350): Simplifying the Test for Goodwill
Impairment. (“ASU 2017-04”) The new guidance eliminates Step 2 of the goodwill impairment test. Instead, the updated
guidance requires an entity to perform its annual or interim goodwill impairment test by comparing the fair value of the reporting
unit to its carrying value, and recognizing a non-cash impairment charge for the amount by which the carrying value exceeds the
reporting unit’s fair value with the loss not exceeding the total amount of goodwill allocated to that reporting unit. ASU
2017-04 is effective for fiscal years beginning after December 15, 2022, with early adoption permitted. The Company early adopted
this guidance in the current fiscal year on a prospective basis and we applied this guidance in calculating the goodwill impairment
charge recognized in fiscal 2020.
| ITEM 7A. |
QUANTITATIVE AND QUALITATIVE DISCLOSURES ABOUT MARKET RISK |
Market
risk represents the risk of loss that may impact our financial position, results of operations or cash flows due to adverse changes
in financial market prices, including interest rate risk, foreign currency exchange rate risk, commodity price risk and other
relevant market rate or price risks.
Due
to the cash and cash equivalent balances that we maintain, we are exposed to risk of changes in short-term interest rates. At
June 30, 2020, we had approximately $28,640,000 in cash and cash equivalents, of which approximately $24,121,000 was invested
in money market accounts and the balance of $4,519,000 (which is inclusive of cash in overseas banks) was held in non-interest
bearing accounts. Reductions in short-term interest rates since March 2020, to mitigate the adverse economic effect of COVID-19,
have resulted in reductions in the amount of income we are able to generate on available cash. However, any adverse impact on
our operating results arising from reductions in interest rates is not expected to be material.
We
do not engage in any activities that would expose us to significant foreign currency exchange rate risk or commodity price risks.
When considered appropriate, we repatriate excess cash from foreign operations. Overseas cash balances were approximately $1,713,000
at June 30, 2020, of which $1,102,000 was in China. Due to the evolving exchange control rules in China, delays can be experienced
in transferring funds out of China.
| ITEM 8. |
FINANCIAL STATEMENTS AND SUPPLEMENTARY DATA |
Index
to Consolidated Financial Statements
REPORT
OF INDEPENDENT REGISTERED PUBLIC ACCOUNTING FIRM
Board
of Directors and Stockholders
Collectors
Universe, Inc.
Opinion
on the financial statements
We
have audited the accompanying consolidated balance sheets of Collectors Universe Inc. (a Delaware corporation) and subsidiaries
(the “Company”) as of June 30, 2020 and 2019, the related consolidated statements of operations, stockholders’
equity, and cash flows for each of the three years in the period ended June 30 2020, and the related notes and schedule included
under Item 15(a) (collectively referred to as the “financial statements”). In our opinion, the financial statements
present fairly, in all material respects, the financial position of the Company as of June 30, 2020 and 2019, and the results
of its operations and its cash flows for each of the three years in the period ended June 30, 2020, in conformity with accounting
principles generally accepted in the United States of America.
Change
in accounting principles
As
described in Note 2 to the financial statements, the Company has changed its method of accounting for leases in fiscal year 2020
due to the adoption of the new leasing standard. The Company adopted the new leasing standard using the current period adoption
method without revising comparative periods.
Basis
for opinion
These
financial statements are the responsibility of the Company’s management. Our responsibility is to express an opinion on
the Company’s financial statements based on our audits. We are a public accounting firm registered with the Public Company
Accounting Oversight Board (United States) (“PCAOB”) and are required to be independent with respect to the Company
in accordance with the U.S. federal securities laws and the applicable rules and regulations of the Securities and Exchange Commission
and the PCAOB.
We
conducted our audits in accordance with the standards of the PCAOB. Those standards require that we plan and perform the audit
to obtain reasonable assurance about whether the financial statements are free of material misstatement, whether due to error
or fraud. The Company is not required to have, nor were we engaged to perform, an audit of its internal control over financial
reporting. As part of our audits we are required to obtain an understanding of internal control over financial reporting but not
for the purpose of expressing an opinion on the effectiveness of the Company’s internal control over financial reporting.
Accordingly, we express no such opinion.
Our
audits included performing procedures to assess the risks of material misstatement of the financial statements, whether due to
error or fraud, and performing procedures that respond to those risks. Such procedures included examining, on a test basis, evidence
regarding the amounts and disclosures in the financial statements. Our audits also included evaluating the accounting principles
used and significant estimates made by management, as well as evaluating the overall presentation of the financial statements.
We believe that our audits provide a reasonable basis for our opinion.
/s/
GRANT THORNTON LLP
We
have served as the Company’s auditor since 2005.
Newport
Beach, California
August
26, 2020
COLLECTORS
UNIVERSE, INC. AND SUBSIDIARIES
CONSOLIDATED
BALANCE SHEETS
(in
thousands, except per share data)
| June 30, |
||||||||
| 2020 | 2019 | |||||||
| ASSETS | ||||||||
| Current assets: | ||||||||
| Cash and cash equivalents |
$ | 28,640 | $ | 19,225 | ||||
| Accounts receivable, net of allowance of $98 in 2020 and $72 in 2019 |
2,324 | 2,408 | ||||||
| Inventories, net | 2,512 | 1,965 | ||||||
| Prepaid expenses and other current assets |
1,872 | 1,400 | ||||||
| Total current assets | 35,348 | 24,998 | ||||||
| Property and equipment, net | 6,762 | 7,259 | ||||||
| Operating lease right-of-use assets | 8,214 | – | ||||||
| Goodwill | 1,625 | 2,083 | ||||||
| Intangible assets, net | 2,446 | 2,329 | ||||||
| Deferred income tax assets | 623 | 561 | ||||||
| Other assets | 464 | 463 | ||||||
| $ | 55,482 | $ | 37,693 | |||||
| LIABILITIES AND STOCKHOLDERS’ EQUITY |
||||||||
| Current liabilities: | ||||||||
| Accounts payable | $ | 3,381 | $ | 2,540 | ||||
| Accrued liabilities | 2,713 | 1,873 | ||||||
| Accrued compensation and benefits |
4,854 | 4,095 | ||||||
| Current portion of long-term debt |
750 | 750 | ||||||
| Operating lease liabilities, current |
2,274 | – | ||||||
| Income taxes payable | 1,142 | 608 | ||||||
| Deferred revenue |
4,968 | 3,428 | ||||||
| Total current liabilities | 20,082 | 13,294 | ||||||
| Deferred rent | – | 3,764 | ||||||
| Long-Term Debt | 938 | 1,688 | ||||||
| Operating lease liabilities, non-current | 9,450 | – | ||||||
| Commitments and contingencies (Note 13) |
||||||||
| Stockholders’ equity: | ||||||||
| Preferred stock, $.001 par value; 3,000 shares authorized; no shares issued or outstanding |
– | – | ||||||
| Common stock, $.001 par value; 20,000 shares authorized; shares outstanding: 9,240 in 2020 and 9,153 in 2019 |
9 | 9 | ||||||
| Additional paid-in capital |
88,918 | 87,343 | ||||||
| Accumulated deficit |
(63,915 | ) | (68,405 | ) | ||||
| Total stockholders’ equity |
25,012 | 18,947 | ||||||
| $ | 55,482 | $ | 37,693 | |||||
The
accompanying notes are an integral part of these consolidated financial statements.
COLLECTORS
UNIVERSE, INC. AND SUBSIDIARIES
CONSOLIDATED
STATEMENTS OF OPERATIONS
(in
thousands, except per share data)
| Year Ended June 30, |
||||||||||||
| 2020 | 2019 | 2018 | ||||||||||
| Grading, authentication and related services revenues |
$ | 78,891 | $ | 72,453 | $ | 68,449 | ||||||
| Cost of grading, authentication and related services |
33,655 | 30,153 | 29,471 | |||||||||
| Gross profit | 45,236 | 42,300 | 38,978 | |||||||||
| Operating expenses: | ||||||||||||
| Selling and marketing expenses |
9,436 | 10,361 | 10,137 | |||||||||
| General and administrative expenses |
21,212 | 17,597 | 19,864 | |||||||||
| Impairment charge |
486 | – | – | |||||||||
| Total operating expenses |
31,134 | 27,958 | 30,001 | |||||||||
| Operating income | 14,102 | 14,342 | 8,977 | |||||||||
| Interest expense, net | 78 | (69 | ) | (114 | ) | |||||||
| Other income (expense), net |
15 | (148 | ) | 29 | ||||||||
| Income before provision for income taxes | 14,195 | 14,125 | 8,892 | |||||||||
| Provision for income taxes |
3,409 | 4,148 | 2,760 | |||||||||
| Income from continuing operations | 10,786 | 9,977 | 6,132 | |||||||||
| Income from discontinued operations, (net of income taxes) |
– | – | 104 | |||||||||
| Net income | $ | 10,786 | $ | 9,977 | $ | 6,236 | ||||||
| Net income per basic share: | ||||||||||||
| Income from continuing operations |
$ | 1.20 | $ | 1.12 | $ | 0.71 | ||||||
| Income from discontinued operations, (net of income taxes) |
– | – | 0.01 | |||||||||
| Net income per share |
$ | 1.20 | $ | 1.12 | $ | 0.72 | ||||||
| Net income per diluted share: | ||||||||||||
| Income from continuing operations |
$ | 1.19 | $ | 1.11 | $ | 0.70 | ||||||
| Income from discontinued operations, (net of income taxes) |
– | – | 0.01 | |||||||||
| Net income per share |
$ | 1.19 | $ | 1.11 | $ | 0.71 | ||||||
| Weighted average shares outstanding: | ||||||||||||
| Basic | 8,984 | 8,937 | 8,662 | |||||||||
| Diluted | 9,068 | 8,970 | 8,817 | |||||||||
| Dividends declared per common share | $ | 0.70 | $ | 0.70 | $ | 1.05 | ||||||
The
accompanying notes are an integral part of these consolidated financial statements.
COLLECTORS
UNIVERSE, INC. AND SUBSIDIARIES
CONSOLIDATED
STATEMENTS OF STOCKHOLDERS’ EQUITY
(in
thousands)
| Common Stock |
Additional Paid-in |
Accumulated | ||||||||||||||||||
| Shares | Amount | Capital | Deficit | Total | ||||||||||||||||
| Balance at June 30, 2017 | 8,921 | $ | 9 | $ | 84,948 | $ | (69,040 | ) | $ | 15,917 | ||||||||||
| Stock-based compensation – restricted stock |
94 | – | 1,421 | – | 1,421 | |||||||||||||||
| Net income | – | – | – | 6,236 | 6,236 | |||||||||||||||
| Dividends paid and accrued |
– | – | – | (9,306 | ) | (9,306 | ) | |||||||||||||
| Balance at June 30, 2018 | 9,015 | 9 | 86,369 | (72,110 | ) | 14,268 | ||||||||||||||
| Stock-based compensation – restricted stock |
138 | – | 974 | – | 974 | |||||||||||||||
| Net income | – | – | – | 9,977 | 9,977 | |||||||||||||||
| Dividends paid and accrued |
– | – | – | (6,272 | ) | (6,272 | ) | |||||||||||||
| Balance at June 30, 2019 | 9,153 | 9 | 87,343 | (68,405 | ) | 18,947 | ||||||||||||||
| Stock-based compensation – restricted stock |
87 | – | 1,575 | – | 1,575 | |||||||||||||||
| Net income | – | – | – | 10,786 | 10,786 | |||||||||||||||
| Dividends paid and accrued |
– | – | – | (6,296 | ) | (6,296 | ) | |||||||||||||
| Balance at June 30, 2020 | 9,240 | $ | 9 | $ | 88,918 | $ | (63,915 | ) | $ | 25,012 | ||||||||||
The
accompanying notes are an integral part of these consolidated financial statements.
CONSOLIDATED
STATEMENTS OF CASH FLOWS
(in
thousands)
| Year Ended June 30, |
||||||||||||
| 2020 | 2019 | 2018 | ||||||||||
| CASH FLOWS FROM OPERATING ACTIVITIES: |
||||||||||||
| Net income |
$ | 10,786 | $ | 9,977 | $ | 6,236 | ||||||
| Adjustments to reconcile net income to net cash provided by operating activities: |
||||||||||||
| (Income) loss from discontinued operations |
– | – | (104 | ) | ||||||||
| Depreciation and amortization expense |
3,040 | 2,812 | 2,306 | |||||||||
| Stock-based compensation expense |
1,575 | 974 | 1,421 | |||||||||
| Non-cash lease expenses | (255 | ) | – | – | ||||||||
| Impairment charge | 486 | – | – | |||||||||
| Provision for bad debts |
26 | 8 | 33 | |||||||||
| Provision for inventory write-down |
252 | 178 | 502 | |||||||||
| Provision for warranty | 462 | 568 | 764 | |||||||||
| Loss on sale of property and equipment |
13 | 71 | 94 | |||||||||
| Changes in operating assets and liabilities: |
||||||||||||
| Accounts receivable | 59 | 188 | 1,001 | |||||||||
| Inventories | (800 | ) | 437 | (359 | ) | |||||||
| Prepaid expenses and other |
(472 | ) | 641 | (305 | ) | |||||||
| Deferred income taxes |
(62 | ) | 661 | 1,642 | ||||||||
| Other assets | (1 | ) | 15 | (66 | ) | |||||||
| Accounts payable and accrued liabilities |
1,223 | (433 | ) | (815 | ) | |||||||
| Accrued compensation and benefits |
760 | 694 | (972 | ) | ||||||||
| Income taxes payable | 534 | 296 | (353 | ) | ||||||||
| Deferred revenue | 1,540 | 215 | 537 | |||||||||
| Deferred rent |
– | 228 | 310 | |||||||||
| Net cash provided by operating activities of continuing operations |
19,166 | 17,530 | 11,872 | |||||||||
| Net cash used in operating activities of discontinued operations |
– | (10 | ) | (215 | ) | |||||||
| Net cash provided by operating activities |
19,166 | 17,520 | 11,657 | |||||||||
| CASH FLOWS FROM INVESTING ACTIVITIES: |
||||||||||||
| Capital expenditures | (1,370 | ) | (915 | ) | (3,923 | ) | ||||||
| Capitalized software development costs |
(1,330 | ) | (1,055 | ) | (911 | ) | ||||||
| Proceeds from sale of property and equipment |
– | 124 | 14 | |||||||||
| Patents and other intangibles |
(1 | ) | – | (5 | ) | |||||||
| Proceeds from sale of business |
– | 12 | 6 | |||||||||
| Net cash used in investing activities |
(2,701 | ) | (1,834 | ) | (4,819 | ) | ||||||
| CASH FLOWS FROM FINANCING ACTIVITIES: |
||||||||||||
| Proceeds from Paycheck Protection Program Loan |
4,204 | – | – | |||||||||
| Repayments of Paycheck Protection Program Loan |
(4,204 | ) | – | – | ||||||||
| Borrowings under term loan |
– | – | 3,000 | |||||||||
| Repayments under term loan |
(750 | ) | (563 | ) | – | |||||||
| Dividends paid to common stockholders |
(6,300 | ) | (6,479 | ) | (9,083 | ) | ||||||
| Net cash used in financing activities |
(7,050 | ) | (7,042 | ) | (6,083 | ) | ||||||
| Increase (decrease) in cash and cash equivalents |
9,415 | 8,644 | 755 | |||||||||
| Cash and cash equivalents at beginning of year |
19,225 | 10,581 | 9,826 | |||||||||
| Cash and cash equivalents at end of year |
$ | 28,640 | $ | 19,225 | $ | 10,581 | ||||||
The
accompanying notes are an integral part of these consolidated financial statements.
CONSOLIDATED
STATEMENTS OF CASH FLOWS (continued)
(in
thousands)
| Year ended June 30, |
||||||||||||
| 2020 | 2019 | 2018 | ||||||||||
| SUPPLEMENTAL DISCLOSURE OF CASH FLOW INFORMATION |
||||||||||||
| Income taxes paid, net | $ | 2,880 | $ | 2,852 | $ | 1,805 | ||||||
| Interest paid | 116 | 157 | 108 | |||||||||
| SUPPLEMENTAL SCHEDULE OF NON-CASH INVESTING ACTIVITIES: |
||||||||||||
| Leasehold Improvements contributed by landlord |
$ | – | $ | – | $ | 2,949 | ||||||
The
accompanying notes are an integral part of these consolidated financial statements.
COLLECTORS
UNIVERSE, INC. AND SUBSIDIARIES
NOTES
TO CONSOLIDATED FINANCIAL STATEMENTS
1.
Nature of Business
Collectors
Universe, Inc. (“we,” “us,” the “Company,” “we”, “Collectors Universe”
or “CUI”) is engaged in the business of providing third-party authentication, grading and related services for collectibles
consisting of coins, trading cards, sports memorabilia and autographs. We authenticate and grade the quality of such collectibles
for dealers, collectors and retail buyers and sellers of these collectibles. We also publish magazines that provide market prices
and information for certain collectibles and high-value assets that are accessible on our websites. We sell advertising and earn
commissions on those websites, and sell advertising in the magazines that we publish; own the CCE subscription business, which
operates an online market for graded collectible coins for dealers who subscribe to this service; and promote, manage and operate
the Long Beach Coin shows.
2.
Summary of Significant Accounting Policies
Basis
of Presentation
The
accompanying consolidated financial statements have been prepared in accordance with accounting principles generally accepted
in the United States of America (GAAP).
Principles
of Consolidation
The
accompanying consolidated financial statements include the accounts of Collectors Universe, Inc. and its wholly owned subsidiaries.
At June 30, 2020, such operating subsidiaries were Certified Asset Exchange, Inc. (CAE), Collectors Universe (Hong Kong) Limited,
Collectors Universe (Shanghai) Limited, Collectors Universe (Japan) Limited and Expos Unlimited, LLC. (Expos), all of which are
ultimately 100% owned by Collectors Universe, Inc. All significant inter-company accounts and transactions have been eliminated
in consolidation.
Reclassification
Certain
prior period amounts have been reclassified to conform to the current year presentation.
Use
of Estimates
The
preparation of financial statements in conformity with accounting principles generally accepted in the United States of America
requires us to make estimates and assumptions that can affect the reported amounts of assets and liabilities and disclosures of
contingent assets and liabilities at the dates of the financial statements and the reported amounts of revenues and expenses during
the reporting periods. Actual results from continuing operations could differ from results expected on the basis of those estimates,
and such differences could be material to our future results of operations and financial condition. Examples of such estimates
that could be material include determinations made with respect to the capitalization and recovery of software development costs,
the valuation of stock-based compensation awards and the timing of the recognition of related stock-based compensation expense,
the valuation of coin and grading consumable inventory, the amount and assessment of goodwill for impairment, the sufficiency
of warranty reserves, and the provisions or benefit for income taxes and the timing of related valuation allowances.
Cash
and Cash Equivalents
We
consider all highly liquid investments with original maturities of three months or less at the date of purchase to be cash and
cash equivalents.
At
June 30, 2020, substantially all of our cash was deposited at one FDIC insured financial institution. Those deposits exceeded
the bank’s FDIC insured deposit limits by approximately $25,622,000 at June 30, 2020. Cash in overseas bank accounts was
approximately $1,713,000 at June 30, 2020, of which $1,102,000 was in China. We repatriate cash back from China to the United
States, as considered necessary and in accordance with China exchange control regulations.
Concentrations
Credit
Risks. Financial instruments that potentially subject the Company to significant concentrations of credit risk at June 30,
2020 and 2019, consisted primarily of cash and cash equivalents and accounts receivables.
Cash
Balances. At June 30, 2020 and 2019, the Company had funds of approximately $24,121,000 and $14,768,000 respectively, in money
market accounts and money market funds. In addition, at June 30, 2020 and 2019, the Company had approximately $4,519,000 and $4,457,000
respectively, in a non-interest bearing bank account for general day-to-day operations.
Accounts
Receivable. A substantial portion of our accounts receivable is due from collectibles dealers. No individual customer’s
account receivable balance was in excess of 10% of the Company’s total gross accounts receivable balances at June 30, 2020.
There was one individual customer’s account receivable balance was approximately 11% of the Company’s total gross
accounts at June 30, 2019. The Company performs an analysis of the expected collectability of accounts receivable based on several
factors, including the age and extent of significant past due accounts and economic conditions or trends that may adversely affect
the ability of the debtors to pay their accounts receivable balances. Based on that review, we establish an allowance for doubtful
accounts, when deemed necessary. The allowance for doubtful accounts receivable was $98,000 and $72,000 at June 30, 2020 and June
30, 2019, respectively. We write-off accounts receivable balances when it is determined that there is no possibility of collection.
Customers.
The authentication and grading of collectible coins and related revenues accounted for approximately 53%, 57%, and 63% of
our net revenues in the years ended June 30, 2020, 2019 and 2018, respectively. In addition, our cards and autograph revenues
and related revenues accounted for 43%, 36% and 31% of total revenues in the years ended June 30, 2020, 2019 and 2018, respectively.
In fiscal 2020, 2019 and 2018, five customers accounted for 10%, 11%, and 16% of our net authentication and grading services,
respectively.
Suppliers.
In order to obtain volume discounts, we have chosen to purchase the injection-molded critical high-volume plastic parts for our
clear plastic holders from a limited number of suppliers. We typically concentrate the purchase of holders through one supplier
when developing new holders. We now have back up suppliers and dies for our critical parts. If it became necessary for us to obtain
parts from an additional supplier, we would have to arrange for the fabrication of a die for that new supplier, which can be a
lengthy process. However, as we own the dies used to manufacture the parts, they should be able to be moved to replacement suppliers.
We believe the inventory of parts we maintain and the availability of back-up suppliers (including overseas suppliers) is sufficient
to give us the time to change suppliers, if considered necessary.
Fair
Value of Financial Instruments
The
carrying value of cash and cash equivalents, accounts receivable, accounts payable and accrued liabilities approximate their estimated
fair values due to the short-term nature of such instruments.
Leases
Effective
July 1, 2019 the Company adopted Accounting Standards Codification (“ASC”) 842 Accounting for Leases and recognized
lease obligations and corresponding right-of-use (ROU) assets for its existing non-cancelable operating leases. The core principle
of this guidance is that a lessee should recognize the assets and liabilities that arise from leases. Therefore, the Consolidated
Balance Sheet at June 30, 2020, included elsewhere in this report, includes the liability to make lease payments (the lease liability)
and a right-of-use asset, representing our right to use the underlying asset for the lease term. We elected not to recognize lease
assets and liabilities for leases with a term of 12 months or less and are recognizing lease expenses for such leases on a straight-line
basis over the lease term. The Company adopted this new accounting guidance, utilizing the current period adoption method without
revising comparative periods and elected not to reassess existing leases. The new standard provides a number of optional practical
expedients in transition. The Company elected to use the package of practical expedients that allows us to not reassess: (i) whether
any expired or existing contracts are or contain leases, (ii) lease classification for any expired or existing leases and (iii)
initial direct costs for any expired or existing leases. In addition, the new standard provides for an accounting election that
permits a lessee to elect not to apply the recognition requirements of Topic 842 to short-term leases by class of underlying asset.
The Company adopted this accounting election for all classes of assets. The Company’s leases consist primarily of office
facilities and the adoption of the new lease standard on July 1, 2019 resulted in the recognition of right-of-use assets of approximately
$9.8 million and lease liabilities for operating leases of approximately $13.6 million on the consolidated balance sheets, with
no material impact on the consolidated statements of operations or consolidated statements of cash flows. See “Note 9-Leases”
for additional information. As a result of COVID-19, we reviewed our lease obligations for impairment and potential excess space
reserve requirements and concluded there were no impairments or charges, required at June 30, 2020.
Revenue
Recognition
The
core principle of ASC 606, Revenue from Contracts with Customers, is that an entity recognizes revenue to depict the transfer
of promised goods or services to customers in an amount that reflects the consideration to which the entity expects to be entitled
in exchange for those goods or services. In applying ASC 606, all revenue transactions must be evaluated using a five-step approach
to determine the amount and timing of revenue to be recognized. The five-step approach requires (1) identifying the contract with
the customer, (2) identifying the performance obligations in the contract, (3) determining the transaction price, (4) allocating
the transaction price to the performance obligations in the contract and (5) recognizing revenue when performance obligations
are satisfied.
Our
primary source of revenue is the authentication and grading of collectibles, which represented about 90% of our consolidated revenues
in the fiscal year ended June 30, 2020. Our other sources of revenues represent the balance of our revenues which are small and
individually account for less than 5% of total revenues.
In
accordance with ASC 606 we recognize revenue for our main revenue streams as follows:
Authentication
and Grading Revenues: As the time it takes to authenticate and grade the collectible is short, we recognize revenue at the
time of shipment (i.e. point of time) of the authenticated graded collectible to the customer, net of any taxes collected. Due
to the insignificant delay between the completion of our authentication and grading services and the shipment of the collectible
back to the customer, the time of shipment corresponds to the completion of our services. We recognize revenue from the sale of
special coin inserts at the time the customer takes legal title to the insert. Many of our authentication and grading customers
prepay our authentication and grading fees when they submit their collectibles to us for authentication and grading. We record
those prepayments as deferred revenue until the collectibles have been authenticated and graded and shipped back to the customer.
At that time, we record the revenues from the authentication and grading services we have performed for the customer and deduct
this amount from deferred revenue. For certain dealers to whom we extend credit, we record revenue at the time of shipment of
the authenticated and graded collectible to the dealer. We provide a limited warranty covering the coins and trading cards that
we authenticate and grade. See Warranty Costs below.
Collectors
Club Revenues: These revenues represent membership fees paid by customers for annual memberships in our Collectors Club. Those
membership fees entitle members to access our on-line and printed publications and, depending on their membership level, to receive
vouchers for authentication and grading services during the membership period. We allocate revenue between the vouchers and the
membership. We recognize revenue attributable to the authentication and grading vouchers consistent with our authentication and
grading services above. The balance of the membership fees is recognized ratably over the life of the membership. Memberships
are paid in advance of the membership period and prepaid memberships fees are classified as deferred revenue. In the event vouchers
expire unused (i.e. there are unexercised customer rights), we consider the guidance under ASC 606 in determining when to recognize
revenue.
Certified
Coin Exchanges Subscription Revenues: We recognize subscription revenues related to our CCE exchange for certified coins,
ratably over the relevant subscription period. Subscriptions are typically billed and paid on a monthly basis, although certain
quarterly and annual subscriptions can be paid in advance. Prepaid subscriptions are classified as part of deferred revenue.
Expos
Trade Show Revenue: We recognize fees earned from promoting, managing, and operating trade shows in the periods in which the
shows take place. Trade show booth fees are typically paid to us in advance. Certain fees that are paid to conduct auctions at
the show are paid to us at the end of the show. Prepaid show fees are classified as part of deferred revenue.
Advertising
and Commission Revenues: Advertising revenues are recognized in the period when an advertisement is displayed in our publications
or websites and customers typically have 30 day credit terms. Click-through commission revenues earned through our websites from
third party affiliate programs are recognized in the period in which the commissions are earned, and such commissions are paid
in the following month.
Product
Sales: Product sales consist primarily of sales of collectibles coins that we have purchased pursuant to our coin authentication
and grading warranty program. We recognize revenues from coin sales when the coins are shipped or delivered to customers or if
the coins are sold through auction, when the auction settles. However, those sales are not considered to be the focus of nor an
integral part of the Company’s ongoing revenue generating activities.
Contract
Balances. As discussed above, the timing of revenue recognition can differ from the timing of invoicing to customers. Contract
liabilities are comprised of billings or payments received from our customers in advance of performance under the contract. We
refer to these contract liabilities as “Deferred Revenue” in the accompanying consolidated balance sheets. During
fiscal 2020, we recognized revenue for substantially all of the deferred revenue balance of $3,428,000 at June 30, 2019.
Shipping
and Handling Costs
Shipping
and handling costs incurred to process and return customer collectibles submitted to us for grading or authentication are recorded
as costs of revenues, net of amounts received from customers, in accordance with the guidance for Principals versus Agents as
set out in ASC 606.
Inventories
Our
inventories consist primarily of (i) collectible coin inventories, and (ii) consumable supplies that we use in our authentication
and grading businesses. Collectible coin inventories are recorded at estimated market value using the specific identification
method. Consumable supplies are recorded at the lower of cost (using the first-in, first-out method) or net realizable value.
Inventories are periodically reviewed to identify slow-moving items, and an allowance for inventory loss is recognized, as necessary.
The allowance for inventory losses was $1,072,000 and $1,278,000 at June 30, 2020 and 2019, respectively. It is possible that
our estimates of market value could change in the near term due to changes in market conditions in the various collectibles markets
served by the Company, which could require us to increase that allowance.
Property
and Equipment
Property
and equipment are stated at cost. Depreciation and amortization are provided using the straight-line method over the estimated
useful lives ranging from three to five years. Leasehold improvements are amortized over the shorter of the estimated useful lives
of the improvements or the term of the related lease. Depreciation and amortization expense are classified as part of general
and administrative expenses. Coin reference sets are non-depreciable assets. Repair and maintenance costs are expensed as incurred.
Goodwill
and Other Intangible Assets
The
Company evaluates the carrying value of its goodwill and certain indefinite-lived intangible assets at least annually for impairment,
or more frequently if facts and circumstances indicate that impairment may have occurred. We formally evaluate the carrying value
of goodwill and other indefinite-lived intangible assets for impairment on the anniversary date of each of the acquisitions that
gave rise to the recording of such assets or more frequently if a triggering event has occurred. We consider qualitative factors
as part of the formal evaluation of the carrying value of goodwill. If qualitative factors are not applicable and the carrying
value of a “reporting unit,” is determined to be less than the fair value of the reporting unit, there exists the
possibility of impairment of goodwill. An impairment loss of goodwill is measured by comparing the current fair value of the reporting
unit to the carrying value of the reporting unit, and, if the implied fair value of goodwill is less than the carrying value of
goodwill, we would record an impairment loss of goodwill calculated as the difference between the implied fair value and carrying
values in the consolidated statements of operations in the period in which the impairment is determined. At June 30, 2020 we recognized
an impairment charge of $458,000 for the remaining goodwill of our Expos business.
Capitalized
Software
Software
development costs are capitalized as part of intangible assets and amortized on a straight-line basis over its useful life of
three years. Through June 30, 2020 and 2019, we had capitalized software costs of approximately $8,622,000 and $7,292,000 respectively,
as capitalized software and we recognized related accumulated amortization expense of $6,373,000 and $5,334,000, respectively.
During fiscal years 2020, 2019 and 2018, the Company recorded amortization expense for capitalized software of approximately $1,039,000,
$892,000, and $701,000, respectively. Planning, training, support and maintenance costs incurred either prior to or following
the implementation phase of a project are recognized as expense in the period in which they occur. We evaluate the carrying value
of capitalized software to determine if the carrying value is impaired, and, if necessary, an impairment loss is recorded in the
period in which the impairment is determined to have occurred.
Long-Lived
Assets
The
Company regularly reviews property and equipment and other long-lived assets, including certain identifiable intangibles, for
possible impairment. This review occurs annually, or more frequently if events or changes in circumstances indicate that the carrying
amount of the asset may not be recoverable in full. If there is an indication of impairment to property, equipment or definite
lived intangible assets, then we prepare an estimate of future undiscounted cash flows expected to result from the use of that
asset and its eventual disposition. If these cash flows are less than the carrying amount of the asset, an impairment loss would
be recognized to write-down the asset to its estimated fair value. Fair value is estimated using the present value of the future
cash flows discounted at a rate commensurate with our estimate of the business risks of the related asset. As a result of the
impairment of the Expos recorded at June 30, 2011, the tradename was determined to have a finite life and was being amortized
over a period of 10 years. However, as part of the impairment charge for Expos at June 30, 2020 we wrote down the remaining carrying
value of the tradename from $28,000 to zero at June 30, 2020.
Warranty
Costs
We
offer a warranty covering the coins and trading cards that we authenticate and grade. Under the warranty, if any coin or trading
card that was previously authenticated and graded by us is later submitted to us for re-grading and either (i) receives a lower
grade upon that re-submittal or (ii) is determined not to have been authentic, we will offer to purchase the collectible, or,
in the alternative, at the customer’s option, pay the difference in value of the item at its original grade, as compared
with its lower grade. However, this warranty is voided if the collectible, upon re-submittal to us, is not in the same tamper-evident
holder in which it was placed at the time we last graded it, or there is evidence that there was tampering with the holder. We
accrue for estimated warranty costs based on historical trends and related experience. We monitor the adequacy of our warranty
reserves on an on-going basis. Net warranty expense recognized was $462,000, $568,000 and $764,000 in fiscal 2020, 2019 and 2018,
respectively. Our warranty reserves were $698,000 and $852,000 at June 30, 2020 and 2019, respectively.
Advertising
Costs
Advertising
costs are expensed as incurred and amounted to approximately $250,000, $260,000, and $286,000 in the fiscal years ended June 30,
2020, 2019 and 2018, respectively.
Income
Taxes
Deferred
tax assets and liabilities are recorded for the future consequences of events that have been recognized in the Company’s
financial statements or tax returns. Measurement of the deferred tax items is based on enacted tax laws. In the event the future
consequences of differences between financial reporting bases and tax bases of the Company’s assets or liabilities result
in a deferred tax asset, we evaluate the probability of realizing the future benefits comprising that asset and record a valuation
allowance if considered necessary.
Accounting
standards prescribe a recognition threshold and a measurement attribute for the financial statement recognition and measurement
of the positions taken or expected to be taken in a tax return. For those benefits to be recognized, a tax position must be more
likely than not to be sustained upon examination by taxing authorities. A “more likely than not” tax position is measured
as the largest amount of benefit that is greater than a fifty percent likelihood of being realized upon ultimate settlement, or
else a full reserve is established against the tax asset or a liability is recorded. Interest and penalties accrued on uncertain
tax positions are recorded as income tax expense.
Foreign
Currency
The
Company has determined that the U.S. dollar is the functional currency for its French branch office and its Hong Kong, Japan and
China subsidiaries. Based on this determination, the Company’s foreign operations are re-measured by reflecting the financial
results of those foreign operations as if they had taken place within a U.S. dollar-based economic environment. Fixed assets and
other non-monetary assets and liabilities are re-measured from foreign currencies to U.S. dollars at historical exchange rates;
whereas cash, accounts receivable and other monetary assets and liabilities are re-measured at current exchange rates. Gains and
losses resulting from those re-measurements, which are included in income for the respective current periods, were not material.
Stock-Based
Compensation
Stock-based
compensation expense is measured at the grant date fair value of an equity-incentive award and is recognized as expense over the
employee or non-employee director’s requisite service period, which is generally the vesting period of the award. However,
if the vesting of a stock-based compensation award is subject to satisfaction of a performance goal or condition, the stock-based
compensation expense is recognized if, and when, (i) performance goals have been established and (ii) it is determined that the
achievement of the performance requirement or condition (and therefore the vesting of the award) has become probable. If stock-based
compensation is recognized due to a determination that a performance goal or condition is probable of being achieved, but it is
subsequently determined that the performance goal or condition was not met in the expected vesting period, then if the shares
can vest in future periods, we will extend the period over which the remaining expense would be recognized. If the award ultimately
fails to vest, or management conclude that it is not probable the shares will vest, then all previously recognized expense with
respect to the performance condition would be reversed.
Net
Income Per Share
Basic
net income per share is computed by dividing net income attributable to common stockholders by the weighted-average number of
common shares outstanding during the periods presented. Diluted net income per share is computed by dividing net income attributable
to common stockholders by the weighted-average number of common and common equivalent shares outstanding during the period presented
assuming the vesting of all outstanding restricted shares. However, anti-dilutive restricted shares and performance based restricted
shares, for which the performance goal has not been achieved at the end of the period are disregarded.
The
following table sets forth the computation of basic and diluted net income (loss) per common share (in thousands except per share
data):
| Year Ended June 30, |
||||||||||||
| 2020 | 2019 | 2018 | ||||||||||
| Income from continuing operations | $ | 10,786 | $ | 9,977 | $ | 6,132 | ||||||
| Income (loss) from discontinued operations (net of income taxes) |
– | – | 104 | |||||||||
| Net income | $ | 10,786 | $ | 9,977 | $ | 6,236 | ||||||
| Net income per basic share: | ||||||||||||
| From continuing operations |
$ | 1.20 | $ | 1.12 | $ | 0.71 | ||||||
| From discontinued operations (net of income taxes) |
– | – | 0.01 | |||||||||
| Net income per share |
$ | 1.20 | $ | 1.12 | $ | 0.72 | ||||||
| Net income per diluted share: | ||||||||||||
| From continuing operations |
$ | 1.19 | $ | 1.11 | $ | 0.70 | ||||||
| From discontinued operations (net of income taxes) |
– | – | 0.01 | |||||||||
| Net income per share |
$ | 1.19 | $ | 1.11 | $ | 0.71 | ||||||
| Weighted-average shares outstanding: | ||||||||||||
| Basic | 8,984 | 8,937 | 8,662 | |||||||||
| Effect of dilutive shares |
84 | 33 | 155 | |||||||||
| Diluted | 9,068 | 8,970 | 8,817 | |||||||||
There
were approximately 21,000 and 5,000 anti-dilutive restricted shares excluded from the computation of diluted income per share
at June 30, 2020 and 2019, respectively.
At
June 30, 2020 and 2019 approximately 52,000, 30,000 and 40,000 performance-based restricted shares were excluded from the computation
of diluted earnings per share, respectively, because we had not reached the performance goals for those shares to vest.
Recent
Accounting Pronouncements
In
June 2016, the FASB issued Accounting Standards Update 2016-13, Financial Instruments-Credit Losses (Topic 326): Measurement
of Credit Losses on Financial Instrument. Subsequent to the issuance of ASU 2016-13, the FASB clarified the guidance through
several ASUs. The collective new guidance (ASC 326) generally requires entities to use a current expected credit loss model, which
is a new impairment model based on expected losses rather than incurred losses. Under this model, an entity would recognize an
impairment allowance equal to its current estimate of all contractual cash flows that the entity does not expect to collect. The
entity’s estimate would consider relevant information about past events, current conditions, and reasonable and supportable
forecasts. ASC 326 is effective for annual and interim fiscal reporting periods beginning after December 15, 2022, with early
adoption permitted for annual reporting periods beginning after December 15, 2018. The Company is continuing to evaluate the expected
impact of this ASC 326 but does not expect it to have a material impact on its consolidated financial statements upon adoption.
In
January 2017, the FASB issued ASU No. 2017-04, Intangibles-Goodwill and Other (Topic 350): Simplifying the Test for Goodwill
Impairment. (“ASU 2017-04”) The new guidance eliminates Step 2 of the goodwill impairment test. Instead, the updated
guidance requires an entity to perform its annual or interim goodwill impairment test by comparing the fair value of the reporting
unit to its carrying value, and recognizing a non-cash impairment charge for the amount by which the carrying value exceeds the
reporting unit’s fair value with the loss not exceeding the total amount of goodwill allocated to that reporting unit. ASU
2017-04 is effective for fiscal years beginning after December 15, 2022, with early adoption permitted. The Company early adopted
this guidance in the current fiscal year on a prospective basis and we applied this guidance in calculating the goodwill impairment
charge recognized in fiscal 2020.
3.
Inventories
Inventories
consist of the following at June 30 (in thousands):
| 2020 | 2019 | |||||||
| Coins | $ | 195 | $ | 173 | ||||
| Grading raw materials consumable inventory |
3,389 | 3,070 | ||||||
| 3,584 | 3,243 | |||||||
| Less inventory reserve |
(1,072 | ) | (1,278 | ) | ||||
| $ | 2,512 | $ | 1,965 | |||||
The
inventory reserve represents a valuation allowance on certain items of our coins inventory based on the current market value of
those coins and for our consumables inventories, based upon our review of the expected future usage of that inventory.
Estimated
market values of coins can be subjective and can vary depending on market conditions for precious metals, the number of qualified
buyers for a particular coin and the uniqueness and special features of a particular coin.
4.
Property and Equipment
Property
and equipment consist of the following at June 30 (in thousands):
| 2020 | 2019 | |||||||
| Coin reference sets | $ | 68 | $ | 68 | ||||
| Computer hardware and equipment | 2,844 | 2,325 | ||||||
| Computer software |
1,752 | 1,606 | ||||||
| Equipment | 5,566 | 5,131 | ||||||
| Furniture and office equipment | 1,113 | 944 | ||||||
| Leasehold improvements | 4,801 | 4,741 | ||||||
| Trading card reference library |
52 | 52 | ||||||
| 16,196 | 14,867 | |||||||
| Less accumulated depreciation and amortization |
(9,434 | ) | (7,608 | ) | ||||
| Property and equipment, net |
$ | 6,762 | $ | 7,259 | ||||
Depreciation
and amortization expense relating to property and equipment for fiscal 2020, 2019 and 2018 was $1,853,000, $1,839,000, and $1,527,000,
respectively.
5.
Goodwill and Intangible Assets
During
the first quarter of fiscal year 2020, we completed our annual review of the carrying value of the goodwill acquired with the
acquisitions of CoinFacts, Inc. (“CFI”) and Certified Coin Exchange (“CCE”), and, on the basis of those
reviews, we determined that no goodwill impairments had occurred. No impairment triggering events were identified for those businesses
through June 30, 2020.
At
June 30, 2020, the Expos goodwill and tradename were determined to be impaired and were written down to zero.
The
following table sets forth the carrying values of goodwill for those acquired businesses that are classified as continuing operations
as of June 30 (in thousands):
| 2020 | 2019 | |||||||
| CoinFacts | $ | 515 | $ | 515 | ||||
| Expos Unlimited | – | 458 | ||||||
| CCE | 1,110 | 1,110 | ||||||
| $ | 1,625 | $ | 2,083 | |||||
Approximately
$1.0 million relating to CCE, classified as goodwill on the consolidated balance sheets at June 30, 2020 and 2019, respectively,
is amortizable and deductible for income tax purposes over a period of 15 years.
The
following table sets forth, by asset class, the amounts classified as other intangible assets, net, on the consolidated balance
sheets as of June 30, 2020 and 2019 (in thousands):
| As of June 30, 2020 |
As of June 30, 2019 |
|||||||||||||||||||||||
| Gross Book Value |
Accumulated Amortization |
Net Book Value |
Gross Book Value |
Accumulated Amortization |
Net Book Value |
|||||||||||||||||||
| Amortized Intangible Assets: |
||||||||||||||||||||||||
| Capitalized Software |
$ | 8,622 | $ | (6,373 | ) | $ | 2,249 | $ | 7,292 | $ | (5,334 | ) | $ | 1,958 | ||||||||||
| Other: | 2,470 | (2,312 | ) | 158 | 2,269 | (2,137 | ) | 132 | ||||||||||||||||
| Indefinite lived Intangible Assets: |
39 | – | 39 | 239 | – | 239 | ||||||||||||||||||
| $ | 11,131 | $ | (8,685 | ) | $ | 2,446 | $ | 9,800 | $ | (7,471 | ) | $ | 2,329 | |||||||||||
Amortization
expense was $1,187,000, $973,000, and $779,000, for the fiscal years ended June 30, 2020, 2019 and 2018, respectively. Estimated
amortization expense for each of the five succeeding years and thereafter relating to amortizable intangible assets, is as follows
(in thousands):
| Fiscal Year Ending June 30, |
||||
| 2021 | $ | 1,216 | ||
| 2022 | 818 | |||
| 2023 | 373 | |||
| $ | 2,407 | |||
The
weighted average amortization period remaining as of June 30, 2020, is approximately 2.2 years.
Amortizable
intangible assets are amortized on a straight-line basis over their estimated useful lives of those assets, which is 3 years for
capitalized software and a range of 5-15 years for other intangibles.
6.
Accrued Liabilities
Accrued
liabilities consisted of the following at June 30 (in thousands):
| 2020 | 2019 | |||||||
| Warranty reserve | $ | 698 | $ | 852 | ||||
| Professional fees and legal settlements accruals |
975 | 141 | ||||||
| Other | 1,040 | 880 | ||||||
| $ | 2,713 | $ | 1,873 | |||||
Warranty
reserve activity and balances related to fiscal years 2020, 2019 and 2018, were as follows (in thousands):
| Warranty reserve at June 30, 2017 | $ | 834 | ||
| Charged to cost of revenues | 764 | |||
| Payments | (736 | ) | ||
| Warranty reserve at June 30, 2018 | 862 | |||
| Charged to cost of revenues | 568 | |||
| Payments | (578 | ) | ||
| Warranty reserve at June 30, 2019 | 852 | |||
| Charged to cost of revenues | 462 | |||
| Payments | (616 | ) | ||
| Warranty reserve at June 30, 2020 | $ | 698 |
7.
Borrowings
Term
Loan. As previously reported, on September 15, 2017 the Company obtained a five-year, $3,500,000 unsecured term loan
from a commercial bank. The Company borrowed $3,000,000 under this loan to fund the Company’s share of the construction
and related facility costs for its new operations and headquarter facility, as well as its moving costs, and lease exit costs
for its former operations and headquarters facility. During that first year the Company was only required to make monthly payments
of interest on the borrowings.
In
September 2018, the loan balance outstanding was automatically converted into a four-year term loan in the principal amount of
the borrowings then outstanding, which was $3,000,000. In October 2018, the Company began repaying the loan in 48 equal monthly
principal payments of $62,500 or $750,000 on an annual basis, through September 2022. There are no prepayment penalties on loan
repayments, as the Company chose a 90-day LIBOR rate to apply to the outstanding balance upon conversion to the four-year term
loan.
The
agreement governing the term loan contains two financial covenants, which require the Company to maintain (a) a funded debt coverage
ratio and (b) a debt service coverage ratio, respectively. The loan agreement also contains certain other covenants typical for
this type of loan, including a covenant which provides that, without the bank’s consent, the Company may not incur additional
indebtedness for borrowed money, except for (i) borrowings under the Company’s revolving credit line, (see below) (ii) purchase
money indebtedness and (iii) capitalized lease obligations.
At
June 30, 2020, the Company had $1,688,000 of outstanding borrowings under this term loan, of which $750,000 was classified as
a current liability and $938,000 was classified as a long-term liability in the Consolidated Balance Sheet at June 30, 2020. The
Company was in compliance with the term loan covenants at June 30, 2020.
Revolving
Credit Line. On March 10, 2020 the Company amended and increased its $10 million unsecured revolving credit line (the “Credit
Line”) to $15 million and extended the term for two years through March 2022. The Company is entitled to obtain borrowings
at such times and in amounts as it may request, as supported by and EBITDA calculation for the last four quarters, provided that
the maximum principal amount of the borrowings that may be outstanding at any one time under the Credit Line may not exceed $15
million and each year there must be a period of 30 consecutive days during which no borrowings are outstanding. The Company also
may, at any time or from time to time and at its option, repay outstanding borrowings, in whole or in part, and may reborrow amounts
so repaid at such times and in such amounts as it deems appropriate.
Credit
Line borrowings will bear interest, at the Company’s option, at LIBOR plus 2.25% or at 0.25% below the highest prime lending
rate published from time to time by the Wall Street Journal. The Company is required to pay a quarterly unused commitment fee
of 0.0625% of the amount by which (if any) that the average of the borrowings outstanding under the Credit Line in any calendar
quarter is less than $6 million.
The
Credit Line agreement contains a financial covenant that requires the Company to maintain a funded debt coverage ratio, similar
to the debt coverage ratio that is applicable to the term loan and certain other covenants typical for this type of credit. At
June 30, 2020 the Company was in compliance with those covenants. Availability to borrow under the line of credit was $15,000,000
at June 30, 2020 however, there were no borrowings outstanding under the line of credit at June 30, 2020 or 2019.
8.
Taxes
For
fiscal years ended June 30, 2020, 2019 and 2018, pre-tax income (loss) was attributed to the following jurisdictions (in thousands):
| 2020 | 2019 | 2018 | ||||||||||
| Domestic operations | $ | 13,845 | $ | 15,691 | $ | 8,015 | ||||||
| Foreign operations | 350 | (1,566 | ) | 877 | ||||||||
| $ | 14,195 | $ | 14,125 | $ | 8,892 | |||||||
Set
forth below is the (benefit) provision for income taxes for continuing operations for the years ended June 30 (in thousands):
| 2020 | 2019 | 2018 | ||||||||||
| Current: | ||||||||||||
| Federal | $ | 3,008 | $ | 2,951 | $ | 816 | ||||||
| State | 381 | 251 | 44 | |||||||||
| International | 82 | 285 | 258 | |||||||||
| 3,471 | 3,487 | 1,118 | ||||||||||
| Deferred: | ||||||||||||
| Federal | (261 | ) | 193 | 1,470 | ||||||||
| State | 199 | 378 | 157 | |||||||||
| International | – | 90 | 15 | |||||||||
| (62 | ) | 661 | 1,642 | |||||||||
| Total provision for income taxes |
$ | 3,409 | $ | 4,148 | $ | 2,760 | ||||||
The
reconciliation of the provision (benefit) for income taxes computed at federal statutory rates to the provision for income taxes
for the years ended June 30 was as follows (in thousands):
| 2020 | 2019 | 2018 | ||||||||||
| Provision at federal statutory rates |
$ | 2,981 | $ | 2,966 | $ | 2,530 | ||||||
| State income taxes, net | 458 | 497 | 142 | |||||||||
| Permanent differences | 123 | 130 | 246 | |||||||||
| International, including change in valuation allowances |
(82 | ) | 590 | 127 | ||||||||
| Other |
(34 | ) | (55 | ) |
25 |
|||||||
| Impact of federal law change | – | – | 280 | |||||||||
| Deficiency (Excess) tax deduction for stock compensation |
(37 | ) | 20 | (590 | ) | |||||||
| $ | 3,409 | $ | 4,148 | $ | 2,760 | |||||||
Deferred
income taxes reflect the net tax effect of temporary differences between the carrying amounts of assets and liabilities for financial
reporting purposes and the amounts used for income tax purposes. Significant components of deferred taxes as of June 30, 2020
and 2019 were as follows (in thousands):
| 2020 | 2019 | |||||||
| Deferred tax assets: | ||||||||
| Stock compensation costs |
$ | 405 | $ | 256 | ||||
| Reserves and accruals | 823 | 1,771 | ||||||
| Net operating loss carryforward |
1,449 | 1,409 | ||||||
| Operating lease liabilities |
2,528 | – | ||||||
| Credits | 206 | 394 | ||||||
| Other | 166 | 132 | ||||||
| 5,577 | 3,962 | |||||||
| Less: valuation allowance |
(1,679 | ) | (1,669 | ) | ||||
| Total deferred tax assets |
3,898 | 2,293 | ||||||
| Deferred tax liabilities: | ||||||||
| Property and equipment | (1,075 | ) | (1,237 | ) | ||||
| Operating lease right-of-use assets |
(1,679 | ) | – | |||||
| Intangibles | (335 | ) | (333 | ) | ||||
| Other | (186 | ) | (162 | ) | ||||
| Total deferred tax liabilities |
(3,275 | ) | (1,732 | ) | ||||
| Net deferred tax assets |
$ | 623 | $ | 561 | ||||
The
Tax Cuts and Jobs Act (“the Tax Act”) significantly revised the U.S. corporate income tax laws by, among other things,
reducing the corporate income tax rate from 35% to 21% and implementing a modified territorial tax system that included a one-time
transition tax on accumulated undistributed foreign earnings. Other provisions included in the Tax Act include limitations on
deductible executive compensation, a repeal of the domestic production activity deduction and several new international provisions.
The
Company completed the accounting for the tax effects of the Tax Act at June 30, 2018. The statutory federal corporate tax rate
for fiscal 2019 was 21% and for fiscal 2018 was 28%, representing in fiscal 2018, a blended tax rate based on the reduced tax
rate being only in effect for six months in that year. In addition, in fiscal 2018 the Company recorded a one-time tax expense
associated with the Tax Act in the amount of $281,000. That tax expense was comprised of $384,000 for the re-measurement of the
Company’s net deferred tax assets to reflect the new lower U.S. tax rate of 21%, partially offset by a one-time benefit
of $103,000 associated with the estimated impact of the Company’s foreign subsidiaries earnings and profits and the impact
of our Hong Kong’s subsidiary’s accumulated deficit.
Realization
of the above gross deferred tax assets is dependent on generating sufficient taxable income in future periods and, in the case
of the net operating losses, we must generate sufficient income primarily in China, France, Hong Kong and Japan. For the California
Enterprise Zone Credits, we must continue to generate taxable income in the California Enterprise Zone. The valuation allowances
of $1,679,000 and $1,669,000 at June 30, 2020 and 2019, respectively, primarily relate to the Company’s foreign operations,
and such valuation allowances have been established due to the uncertainty of realizing our foreign tax benefits. The Company
recognized a valuation allowance of $581,000 against the deferred tax asset of the China operation at June 30, 2019.
The
Company files income tax returns in the U.S. federal jurisdiction, various states and overseas in France, Hong Kong, China and
Japan and has open tax periods for federal income taxes for the years ended June 30, 2017 through June 30, 2019 and for certain
state tax jurisdictions for the years ended June 30, 2000 through June 30, 2019.
As
of June 30, 2020, and June 30, 2019, the Company had $260,000 and $499,000, respectively, of California Enterprise Zone Credits.
These credits can only be utilized to offset taxable income generated in the California Enterprise Zone. Carryovers of existing
California Enterprise Zone Credits (earned before June 30, 2017) expire in tax year 2025. The Company has foreign net operating
loss carryforwards in France, China, Japan and Hong Kong of $2,371,000, $781,000, $271,000 and $2,432,000, respectively. Net operating
losses can be carried forward indefinitely in France and Hong Kong whereas in China they can be carried forward for five years
and in Japan for ten years. Therefore, in China net operating losses will begin to expire in 2023 and in Japan in 2029.
As
of June 30, 2020, the liability for income taxes associated with uncertain tax positions was $465,000, including accrued penalties
and interest of $177,000. If recognized, $416,000 of the liability for uncertain tax positions would favorably affect the Company’s
effective tax rate.
A
reconciliation of the beginning and ending amount of unrecognized tax benefits, excluding interest and penalties, is as follows
(in thousands):
| Unrecognized tax benefits balance at June 30, 2018 |
$ | 288 | ||
| Gross increases for tax positions of prior years |
– | |||
| Gross decreases for tax positions of prior years |
– | |||
| Gross increases for tax positions of current year |
– | |||
| Settlements | – | |||
| Lapse of statute of limitations | – | |||
| Unrecognized tax benefits balance at June 30, 2019 |
288 | |||
| Gross increases for tax positions of prior years |
– | |||
| Gross decreases for tax positions of prior years |
– | |||
| Gross increases for tax positions of current year |
– | |||
| Settlements | – | |||
| Lapse of statute of limitations | – | |||
| Unrecognized tax benefits balance at June 30, 2020 |
$ | 288 |
The
liability for uncertain tax positions is reviewed quarterly and adjusted as events occur that affect potential liabilities for
additional taxes, such as lapsing of applicable statutes of limitations, proposed assessments by tax authorities, negotiations
with taxing authorities, identification of new issues, and enactment of new legislation, regulations or promulgation of new case
law. We believe that adequate amounts of tax and related interest, if any, have been provided for any adjustments that may result
from the examinations of uncertain tax positions. The Company does not expect the liability for uncertain tax positions to change
significantly over the next year.
The
Company has analyzed the impact of the provisions of the Tax Reform Act which will be effective in future years. The Company’s
selection of an accounting policy with respect the Global Intangible Low-Taxed Income (“GILTI”) tax rules is to treat
the GILTI tax as a period cost.
9.
Leases
(i)
Leases under ASC 842
The
Company has operating leases for office facilities and certain equipment. Our leases have remaining terms ranging from 1 year
to 8 years, some of which included options to extend. We did not include options to extend in our determination of the valuation
of our right-of-use (ROU) assets and lease liabilities, as it was not considered reasonably certain that we will exercise those
options. Lease expense is recognized on a straight-line basis over the lease term. Some of our leases have variable payments of
property taxes, insurance and common area maintenance, in addition to base rent. These variable payments are expensed when incurred
and are recorded as variable rent expense.
Operating
lease right-of-use assets and liabilities are measured using the present value of future minimum lease payments over the lease
term. We applied our incremental borrowing rate based on the information available at the adoption date. This rate was applied
to the entire portfolio of leases on the basis that any adjustments to the rate due to lease terms or asset classifications would
not have a material effect to the valuation of the lease liabilities or ROU assets.
Information
related to the Company’s total lease costs were as follows (in thousands):
|
Year June |
||||
| Operating lease cost | $ | 2,133 | ||
| Variable lease cost |
551 | |||
| Total lease cost | $ | 2,684 | ||
Information
related to the Company’s ROU assets and related lease liabilities were as follows (in thousands):
|
Year June |
||||
| Cash paid for operating lease liabilities |
$ | 2,337 | ||
| Weighted-average remaining lease term | 7.3 years |
|||
| Weighted-average discount rate | 4.8 | % | ||
The
table below reconciles the undiscounted future minimum lease payments (displayed by year and in the aggregate) under noncancellable
operating leases with terms of more than one year to the total operating lease liabilities recognized on the condensed consolidated
balance sheet as of June 30, 2020 (in thousands):
| Year Ending June 30, |
||||
| 2021 | $ | 2,324 | ||
| 2022 | 1,986 | |||
| 2023 | 1,647 | |||
| 2024 | 1,473 | |||
| 2025 | 1,468 | |||
| Thereafter | 5,070 | |||
| Total undiscounted future minimum lease payments |
$ | 13,968 | ||
| Less: Imputed interest |
(2,244 | ) | ||
| Total operating lease liabilities |
$ | 11,724 | ||
| Current operating lease liabilities | $ | 2,274 | ||
| Long-term operating lease liabilities |
9,450 | |||
| Total operating lease liabilities |
$ | 11,724 | ||
As
of June 30, 2020, we did not have additional finance or operating leases that have not yet commenced that would create significant
obligations for us.
(ii)
Leases under ASC 840
Prior
to the adoption of ASC 842 the Company’s rent expense for its occupied facilities at June 30, 2019 was recognized on a straight-line
basis over the lease period. Total rent expense for the fiscal years ended June 30, 2019 and 2018 for those leases was approximately
$2,366,000 and $2,401,000, respectively.
Future
minimum lease payments under those agreements at June 30, 2019, were as follows (in thousands):
|
Year |
Gross Amount |
|||
| 2020 | $ | 2,457 | ||
| 2021 | 2,424 | |||
| 2022 | 2,044 | |||
| 2023 | 1,660 | |||
| 2024 | 1,465 | |||
| Thereafter | 6,535 | |||
| $ | 16,585 | |||
10.
Employee Benefit Plans
We
have an employee benefit plan that contains a 401(k) salary deduction provision covering all employees who meet the eligibility
requirements of the plan. Eligible employees are able to defer up to the lesser of 75% of their base compensation or the statutorily
prescribed annual limit. Effective January 1, 2020, the Company began providing matching contributions to the plan and the current
match is 50% of up to 6% of a participant’s compensation that is contributed to the plan. Total Company contributions for
the period January 1, 2020 through June 30, 2020 were approximately $224,000.
11.
Stockholders’ Equity
Dividends
During
the fiscal years ended June 30, 2020, 2019 and 2018, the Company paid cash dividends to our stockholders in the aggregate amounts
of approximately $6,300,000, $6,479,000, and $9,083,000, respectively.
In
February 2018, the Company reduced its quarterly cash dividend rate to $0.175 per share from $0.35 per share.
The
declaration of cash dividends in the future, pursuant to the Company’s dividend policy, is subject to final determination
each quarter by the Board of Directors based on a number of factors, including the Company’s financial performance and its
available cash resources, its cash requirements and alternative uses of cash that the Board may conclude would represent an opportunity
to generate a greater return on investment for the Company.
12.
Stock Incentive Plans
On
October 3, 2017, the Board of Directors adopted and on December 5, 2017, our stockholders approved the 2017 Equity Incentive Plan
(“2017 Plan”), which authorizes the issuance of up to 400,000 shares of common stock for the grant of stock options,
stock appreciation rights (commonly referred to as “SARS”), restricted stock and restricted stock units (collectively,
“stock awards”), to officers and other employees of and non-employee directors or consultants to the Company or its
subsidiaries. At the time of the adoption of the 2017 Plan, a total of 308,670 shares of common stock remained available for the
grant of stock awards under previously adopted stock incentive plans that had been approved by our stockholders. The total number
of shares remaining shares available for future issuances at June 30, 2020, under all equity incentive plans was 390,000 shares.
Stock
Awards
In
recent years, to create incentives for management, to remain in the service of the Company and to drive cash generation, restricted
stock awards are made on an annual basis to officers and key employees under Long Term Incentive Plans (“LTIPs”) comprising
service-based awards (“RSUs”) and performance based-awards (“PSUs”). In addition, there are annual RSU
awards to directors for their annual services as directors and special awards to certain officers or employees, at the discretion
of the Compensation Committee of the Board of Directors.
In
all instances for the awards to vest the employee or outside director must provide continuous service through the vesting date
of the award. In the event of a termination of continuous service, for any reason, prior to its vesting date, the award is forfeited.
Fiscal
2020, 2019 and 2018 LTIP Awards
RSUs
One
Time Award. A total, net of forfeitures, of 17,505 RSUs were awarded in December 2017, which vested in two installments, on
June 30, 2019 and 2018, respectively. Through June 30, 2019 these service shares were fully vested.
Annual
Awards. A total, net of forfeitures, of 25,952, 44,763 and 16,731 RSUs were awarded in fiscal 2020, 2019 and 2018, respectively,
with vesting in three annual installments on the last day of the fiscal years following the grants.
At
June 30, 2020 17,303 and 15,519 of the fiscal 2020 and 2019 awards remained unvested.
Fiscal
2020 and 2019 PSUs
To
focus management’s efforts on the achievement of increases in net cash flows (defined as net cash generated by the Company’s
continuing activities, minus capital expenditures and capitalized software costs), during the three years ending June 30, 2022
and 2021, (the “Performance Periods”), in fiscal 2020 and 2019, the Compensation Committee granted 51,905 and 89,542
PSUs (at maximum) to LTIP Participants. Provisional vesting of the PSUs was made contingent on the achievement of net cash flows
on an annual basis with final vesting, subject to possible upward or downward adjustment of 20% of the PSUs, based on a comparison
of the Company’s total shareholder return (“TSR”) for the three year Performance Period, to the TSR of the Russell
2000 Index, for the same Performance Period. Threshold, target and maximum net cash flow goals were established for fiscal 2020
and 2019 and grant dates were established for that year’s PSUs, for expense recognition purposes. In fiscal 2019 and 2020,
the Company achieved the maximum net cash flows performance under the targets established for those years and as a result 14,426
and 49,121 shares are provisionally vested under the fiscal 2020 and 2019 LTIP, respectively.
For
any of the PSUs to fully vest, a Participant must provide continuous service through the end of the respective three year Performance
Periods. Stock-based compensation expense of $610,000 and $80,000 was recognized in fiscal 2020 and 2019, respectively, for these
PSUs, and such expenses includes an estimate for the Company’s expected TSR performance as compared to the Russell 2000
Index, over the respective performance periods to date.
Fiscal
2018 PSUs
Through
June 30, 2020 no stock-based compensation expense was recognized for 30,370 2018 PSUs awards, as the 2018 Performance Goal was
not achieved, and those shares were forfeited as of June 30, 2020.
The
net cash flows goals for fiscal years 2021 and 2022 will be set in those fiscal years, which will give rise to grant dates for
expense recognition purposes.
2013
LTIP Awards
As
previously reported, based on the financial results achieved in fiscal 2017, the Company achieved the maximum performance goal
under the 2013 LTIP, in fiscal 2017. Therefore, in accordance with the terms of the 2013 LTIP, the remaining 50% of the 2013 LTIP
shares vested on June 30, 2018. Stock-based compensation expense recognized for those shares was approximately $503,000, in fiscal
2018. There was no compensation expense required to be recognized under the 2013 LTIP in fiscal 2020 and 2019.
Non-Employee
Director Award
In
each of fiscal years 2020, 2019, and 2018, each of our non-employee directors was granted restricted service-based shares with
grant date fair values of $45,000, for a total fair value of $180,000 in both fiscal 2020, and fiscal 2019, and $315,000 in fiscal
2018. Those shares have a one year vesting period, coinciding with the directors’ service period and the shares vest 25%
on a quarterly basis.
CEO
Awards
On
March 16, 2020, the Company granted Mr. Orlando, the Company’s CEO, a total of 32,278 restricted shares, comprising 16,139
service-based RSUs and 16,139 performance-based PSUs.
The
RSUs vest in three equal annual installments on March 16, 2021, 2022, and 2023, respectively.
The
PSUs vest in three equal installments based on the annual revenue performance of the business in fiscal years ending June 30,
2020, 2021 and 2022, respectively. The 16,139 PSUs referenced above represent the number of shares that can be earned at target.
If maximum performance is achieved, an additional 25% of that year’s PSUs will be earned. Threshold, target and maximum
revenue goals were established by the Compensation Committee of the Board of Directors for fiscal 2020. Based on the revenue generated
by the Company in fiscal 2020, a determination was made by the Compensation Committee that one-third of the PSUs or 5,379 had
vested. Threshold, target and maximum performance goals will be established for the fiscal years 2021 and 2022 PSUs in those respective
years, which will give rise to grant dates for expense recognition purposes.
Stock-based
compensation expense related to these grants was $108,000 in fiscal 2020.
Other
Service-Based Awards
In
each of fiscal 2019 and 2018 the Company granted to other employees 5,000 service-based restricted shares, with grant date fair
values of $111,000 and $83,000 respectively, and with vesting periods of four years.
The
following table shows total stock-based compensation expense included as part of continuing operations in the Consolidated Statements
of Operations, as follows (in thousands):
| Year Ended June 30, |
||||||||||||
| Included in: | 2020 | 2019 | 2018 | |||||||||
| Selling and marketing expenses | 29 | 70 | 98 | |||||||||
| General and administrative expenses |
1,546 | 904 | 1,323 | |||||||||
| $ | 1,575 | $ | 974 | $ | 1,421 | |||||||
The
related tax benefit recognized for stock-based compensation expense was approximately $418,000, $254,000 and $1,035,000 in fiscals
2020, 2019 and 2018, respectively.
A
total of $1,935,000 of compensation expense related to unvested stock-based compensation awards remained unrecognized as of June
30, 2020 based on the assumption that the holders of the equity awards will remain in the Company’s service through 2023.
That expense will be recognized in future periods, as follows (in thousands):
| Year Ending June 30, |
||||
| 2021 | $ | 1,321 | ||
| 2022 | 530 | |||
| 2023 | 84 | |||
| Total | $ | 1,935 | ||
The
$1,935,000 of unrecognized expense does not include expense arising from (i) the grant of any additional stock-based awards that
may be granted in future periods and, (ii) the PSUs granted under the 2020 and 2019 LTIP for which grant dates are to be established
in fiscal 2021 and 2022.
The
following table presents the non-vested status of the restricted shares for the fiscal years ended June 30, 2020, 2019 and 2018
and their respective weighted average grant date fair values (in thousands, except per share data):
| Non-Vested Shares: |
Number of Shares (in |
Weighted Average Grant-Date Fair (per |
||||||
| Non-vested at June 30, 2017 | 431 | $ | 13.97 | |||||
| Granted | 100 | 29.43 | ||||||
| Vested | (442 | ) | 14.13 | |||||
| Cancelled | (6 | ) | 28.97 | |||||
| Non-vested at June 30, 2018 | 83 | 28.23 | ||||||
| Granted | 162 | 13.28 | ||||||
| Vested | (40 | ) | 20.85 | |||||
| Cancelled | (24 | ) | 23.63 | |||||
| Non-vested at June 30, 2019 | 181 | 17.11 | ||||||
| Granted | 117 | 24.77 | ||||||
| Vested | (52 | ) | 15.94 | |||||
| Cancelled | (30 | ) | 30.25 | |||||
| Non-vested at June 30, 2020 | 216 | $ | 18.72 | |||||
13.
Commitments and Contingencies
The
Company has various operating lease commitments for facilities and equipment some of which contain renewal options. On February
3, 2017, the Company, as tenant, entered into a triple net lease (as amended) pursuant to which the Company is leasing approximately
62,755 rentable square feet space for its operations and headquarters facility. The term of the lease is 10 years and 10 months,
which commenced on, December 1, 2017. The Company received an abatement of the monthly rent for the period from January 1, 2018
through October 31, 2018. The landlord contributed approximately $2.9 million to the tenant improvements. At June 30, 2020 aggregate
minimum obligations over the remaining term of the lease is approximately $12.0 million.
We
also lease offices for our overseas operations including a five year lease for our Shanghai office that commenced in November
2017, with aggregate minimum obligations over the term of the lease of approximately $3.0 million and a three year lease for our
offices Hong Kong, which commenced in July 2018, with aggregate minimum obligations over the term of that lease of approximately
$625,000.
The
Company’s rent expense for its existing occupied facilities is recognized on a straight-line basis over the lease period.
Total rent expense for the fiscal years ended June 30, 2020, 2019 and 2018 for those operations classified as continuing operations
was approximately $2,549,000, $2,366,000, and $2,401,000, respectively.
Future
minimum lease payments under those agreements associated with our continuing operations at June 30, 2020, are as follows (in thousands):
|
Year |
Gross Amount |
|||
| 2021 | $ | 2,514 | ||
| 2022 | 2,138 | |||
| 2023 | 1,663 | |||
| 2024 | 1,473 | |||
| 2025 | 1,470 | |||
| Thereafter | 5,069 | |||
| $ | 14,327 | |||
Employment
Agreements
The
Company has entered into employment agreements with certain executive officers and other key employees. The employment agreements
provide for minimum salary levels, incentive compensation and severance benefits, among other items.
Indemnification
Obligations
The
Company from time to time enters into certain types of contracts that contingently require the Company to indemnify parties against
third-party claims. These contracts primarily relate to (i) certain real estate leases under which the Company may be required
to indemnify property owners for environmental or other liabilities and other claims arising from the Company’s use of the
applicable premises; and (ii) certain agreements with the Company’s officers and directors, under which the Company may
be required to indemnify such persons for liabilities arising out of their relationships as officers or directors of the Company.
The terms of such indemnification obligations vary by contract and in most instances a specific or maximum dollar amount is not
explicitly stated therein. Historically, the Company has not been obligated to make significant payments under, and no liabilities
have been recorded in the accompanying consolidated balance sheets for these indemnification obligations.
Legal
Proceedings
The
Company is named from time to time, as a defendant in lawsuits that arise in the ordinary course of business. We establish accruals
for lawsuits or disputes if and when it is determined that a loss is both probable and can be reasonably estimated. Accruals can
be adjusted from time to time, in light of additional or changed information or based on a re-assessment of the risk and costs
of proceeding with lawsuits and disputes. In fiscal 2020, the Company recognized approximately $967,000 related to pre-trial litigation
settlements of which $845,000 was recognized in the fourth quarter of fiscal 2020. We currently believe that none of the lawsuits
currently pending against the Company, is likely to have a material adverse effect on the Company.
14.
Business Segments
The
operating segments of the Company are organized based on the respective services that they offer to customers of the Company.
Similar operating segments have been aggregated to reportable operating segments based on having similar services, types of customers,
and other criteria. For our continuing operations, we operate principally in three reportable service segments: coins, trading
cards and autographs and other collectibles. Services provided by these segments include authentication, grading, publication
and web-based advertising and subscription-based revenues. The other collectibles segment includes CCE, Coinflation.com, Collectors.com
and Expos and product sales.
We
allocate operating expenses to each service segment based upon activity levels. The following tables set forth on a business segment
basis, (i) external revenues, (ii) amortization and depreciation; (iii) stock-based compensation expense as significant other
non-cash transactions; and (iv) operating income for the fiscal years ended June 30, 2020, 2019 and 2018. Net identifiable assets
and goodwill are provided by business segment as of June 30, 2020 and 2019.
| Year Ended June 30, |
||||||||||||
| Net Revenues from external customers (1) |
2020 | 2019 | 2018 | |||||||||
| Coins | $ | 41,599 | $ | 41,394 | $ | 42,838 | ||||||
| Trading cards and autographs |
33,673 | 26,420 | 21,065 | |||||||||
| Other | 3,619 | 4,639 | 4,546 | |||||||||
| Total revenue |
$ | 78,891 | $ | 72,453 | $ | 68,449 | ||||||
| Depreciation and Amortization: | ||||||||||||
| Coins | $ | 1,539 | $ | 1,360 | $ | 954 | ||||||
| Trading cards and autographs |
702 | 581 | 394 | |||||||||
| Other | 329 | 428 | 562 | |||||||||
| Total | 2,570 | 2,369 | 1,910 | |||||||||
| Unallocated amortization and depreciation |
470 | 443 | 396 | |||||||||
| Consolidated amortization and depreciation |
$ | 3,040 | $ | 2,812 | $ | 2,306 | ||||||
| Stock-based compensation: | ||||||||||||
| Coins | $ | 262 | $ | 143 | $ | 385 | ||||||
| Trading cards and autographs |
120 | 33 | 63 | |||||||||
| Other | 49 | 32 | 63 | |||||||||
| Total | 431 | 208 | 511 | |||||||||
| Unallocated stock-based compensation |
1,144 | 766 | 910 | |||||||||
| Consolidated stock-based compensation |
$ | 1,575 | $ | 974 | $ | 1,421 | ||||||
| Operating income: | ||||||||||||
| Coins | $ | 11,995 | $ | 10,536 | $ | 9,051 | ||||||
| Trading cards and autographs |
9,328 | 7,841 | 5,540 | |||||||||
| Other | 621 | 1,283 | 1,190 | |||||||||
| Total | 21,944 | 19,660 | 15,781 | |||||||||
| Unallocated operating expenses |
(7,842 | ) | (5,318 | ) | (6,804 | ) | ||||||
| Consolidated operating income |
$ | 14,102 | $ | 14,342 | $ | 8,977 | ||||||
| (1) | Includes revenues of $8.4 million, $7.6 million, and $11.1 million, generated outside the United States in fiscal years 2020, 2019 and 2018, respectively. |
| At June 30, |
||||||||
| Identifiable Assets: | 2020 | 2019 | ||||||
| Coins | $ | 10,836 | $ | 9,398 | ||||
| Trading cards and autographs |
4,633 | 3,753 | ||||||
| Other | 1,778 | 2,468 | ||||||
| Total | 17,247 | 15,619 | ||||||
| Unallocated assets |
38,235 | 22,074 | ||||||
| Consolidated assets |
$ | 55,482 | $ | 37,693 | ||||
| Goodwill: | ||||||||
| Coins | $ | 515 | $ | 515 | ||||
| Other | 1,110 | 1,568 | ||||||
| Consolidated goodwill |
$ | 1,625 | $ | 2,083 | ||||
15.
Quarterly Results (unaudited)
The
following table sets forth the unaudited consolidated financial results for quarterly periods in fiscal years 2020 and 2019:
Quarterly
Results of Operations
|
Quarter (In |
||||||||||||||||||||||||||||||||
|
Sept. 2018 |
Dec.31, 2018 |
Mar.31, 2019 |
June 30, 2019 |
Sept. 30, 2019 |
Dec. 31, 2019 |
Mar. 31, 2020 |
June 30, 2020 |
|||||||||||||||||||||||||
| Statement of Operations Data: |
||||||||||||||||||||||||||||||||
| Net revenues |
$ | 17,495 | $ | 15,704 | $ | 19,471 | $ | 19,783 | $ | 20,210 | $ | 19,456 | $ | 18,723 | $ | 20,502 | ||||||||||||||||
| Cost of revenue |
7,202 | 6,953 | 7,827 | 8,171 | 8,101 | 8,533 | 8,771 | 8,250 | ||||||||||||||||||||||||
| Gross profit |
10,293 | 8,751 | 11,644 | 11,612 | 12,109 | 10,923 | 9,952 | 12,252 | ||||||||||||||||||||||||
| Operating Expenses: |
||||||||||||||||||||||||||||||||
| SG&A expense(i) |
7,466 | 6,537 | 6,879 | 7,076 | 7,472 | 7,649 | 7,310 | 8,217 | ||||||||||||||||||||||||
| Impairment Charge(ii) |
– | – | – | – | – | – | – | 486 | ||||||||||||||||||||||||
| Operating income |
2,827 | 2,214 | 4,765 | 4,536 | 4,637 | 3,274 | 2,642 | 3,549 | ||||||||||||||||||||||||
| Interest and other income (expense), net |
3 | (145 | ) | (4 | ) | (71 | ) | 71 | 4 | 38 | (20 | ) | ||||||||||||||||||||
| Income before provision for income taxes |
2,830 | 2,069 | 4,761 | 4,465 | 4,708 | 3,278 | 2,680 | 3,529 | ||||||||||||||||||||||||
| Provision for income taxes (iii) |
699 | 588 | 1,202 | 1,659 | 1,095 | 664 | 753 | 897 | ||||||||||||||||||||||||
| Net Income |
$ | 2,131 | $ | 1,481 | $ | 3,559 | $ | 2,806 | $ | 3,613 | $ | 2,614 | $ | 1,927 | $ | 2,632 | ||||||||||||||||
| Net income per share: |
||||||||||||||||||||||||||||||||
| Basic | $ | 0.24 | $ | 0.17 | $ | 0.40 | $ | 0.31 | $ | 0.40 | $ | 0.29 | $ | 0.21 | $ | 0.29 | ||||||||||||||||
| Diluted | $ | 0.24 | $ | 0.17 | $ | 0.40 | $ | 0.31 | $ | 0.40 | $ | 0.29 | $ | 0.21 | $ | 0.29 | ||||||||||||||||
| Weighted average shares outstanding: |
||||||||||||||||||||||||||||||||
| Basic | 8,933 | 8,936 | 8,938 | 8,943 | 8,973 | 8,980 | 8,989 | 8,993 | ||||||||||||||||||||||||
| Diluted | 8,962 | 8,947 | 8,966 | 9,004 | 9,060 | 9,061 | 9,073 | 9,078 | ||||||||||||||||||||||||
| (i) | In the fourth quarter of fiscal 2020, the Company recognized approximately $845,000 of pre-trial litigation costs that are included in SG&A expense in that quarter. |
|
| (ii) | The impairment reserve in the fourth quarter of fiscal 2020 related to our Expos tradeshow business. See Recent Developments-Coronavirus (COVID-19) above. |
|
| (iii) | The higher ETR in the fourth quarter of fiscal 2019, reflects a non-cash valuation allowance established against deferred tax assets in China as of June 30, 2019. See Provisions for Income Taxes above. |
16.
Subsequent Events
Dividends
On
August 3, 2020, the Company announced its quarterly cash dividend of $0.175 per share of common stock for the first quarter of
fiscal 2021. The cash dividend will be paid on August 28, 2020 to stockholders of record on August 14, 2020.
| ITEM 9. |
CHANGES IN AND DISAGREEMENTS WITH ACCOUNTANTS ON ACCOUNTING AND FINANCIAL DISCLOSURE |
None
| ITem 9a. |
CONTROLS AND PROCEDURES |
Disclosure
Controls and Procedures
We
maintain disclosure controls and procedures that are designed to ensure that information required to be disclosed in our reports
under the Securities Exchange Act of 1934, as amended (the “Exchange Act”) is recorded, processed, summarized and
reported within the time periods specified in the rules and forms of the Securities and Exchange Commission (the “SEC”),
and that such information is accumulated and communicated to our management, including our Chief Executive Officer and Chief Financial
Officer, to allow timely decisions regarding required disclosure. In designing and evaluating our disclosure controls and procedures,
our management recognized that any system of controls and procedures, no matter how well designed and operated, can provide only
reasonable assurance of achieving the desired control objectives, as ours are designed to do, and management necessarily was required
to apply its judgment in evaluating the cost-benefit relationship of possible controls and procedures.
As
required by SEC rules, an evaluation was performed under the supervision and with the participation of our Chief Executive Officer
and Chief Financial Officer of the effectiveness, as of June 30, 2020, of the Company’s disclosure controls and procedures
(as defined in Rule 13a-15(e) under the Exchange Act). Based on that evaluation, our Chief Executive Officer and Chief Financial
Officer concluded that, as of June 30, 2020, the Company’s disclosure controls and procedures were effective to provide
reasonable assurance that information required to be disclosed in our reports that we file under the Exchange Act is recorded,
processed, summarized and reported within the time periods specified in the SEC’s rules and forms and that such information
is accumulated and communicated to management, including our Chief Executive Officer and Chief Financial Officer, to allow timely
decisions regarding required disclosure.
Changes
in Internal Control over Financial Reporting
There
were no changes in our internal control over financial reporting that occurred during our fourth fiscal quarter ended June 30,
2020 that have materially affected, or are reasonably likely to materially affect, our internal control over financial reporting.
Management’s
Report on Internal Control Over Financial Reporting
Management
of Collectors Universe, Inc. is responsible for establishing and maintaining adequate internal control over financial reporting
as defined in Rules 13a-15(f) and 15d-15(f) under the Exchange Act. Our internal control over financial reporting is a process
designed to provide reasonable assurance regarding the reliability of financial reporting and the preparation of financial statements
for external purposes in accordance with accounting principles generally accepted in the United States of America. Internal control
over financial reporting includes those written policies and procedures which:
| ● | pertain to the maintenance of records that, in reasonable detail, accurately and fairly reflect the transactions and dispositions of our assets; |
|
| ● | provide reasonable assurance that transactions are recorded as necessary to permit preparation of financial statements in accordance with accounting principles generally accepted in the United States of America; |
|
| ● | provide reasonable assurance that our receipts and expenditures are being made only in accordance with authorization of our management and directors; and |
|
| ● | provide reasonable assurance regarding prevention or timely detection of unauthorized acquisition, use or disposition of assets that could have a material effect on our consolidated financial statements. |
Internal
control over financial reporting includes the controls themselves, monitoring and internal auditing practices and actions taken
to correct deficiencies as identified.
Because
of its inherent limitations, internal control over financial reporting may not prevent or detect misstatements. Also, projections
of any evaluation of effectiveness to future periods are subject to the risks that controls may become inadequate because of changes
in conditions or because the degree of compliance with the policies or procedures may deteriorate.
Management’s
Assessment and Determination
Our
management assessed the effectiveness of Collectors Universe’s internal control over financial reporting as of June 30,
2020, based on criteria for effective internal control over financial reporting described in the 2013 Internal Control –
Integrated Framework (the “2013 Framework”) issued by the Committee of Sponsoring Organizations of the Treadway
Commission. Management’s assessment included an updated evaluation of the design and the testing of the operational effectiveness
of Collectors Universe’s internal control over financial reporting based on the 2013 Framework. Management reviewed the
results of its assessment with the Audit Committee of our Board of Directors.
Based
on that assessment, management determined that, as of June 30, 2020, Collectors Universe, Inc. maintained effective internal control
over financial reporting.
We
are no longer required to include, and this Annual Report does not include, an attestation report of our registered public accounting
firm regarding internal control over financial reporting, and management’s report, set forth above, was not subject to attestation
by our registered public accounting firm, pursuant to rules of the SEC that permit us, as a smaller reporting company, to provide
only management’s assessment of the effectiveness of the Company’s internal control over financial reporting which
is set forth above.
| ITEM 9B. |
OTHER INFORMATION |
None
| ITEM 10. |
DIRECTORS, EXECUTIVE OFFICERS AND CORPORATE GOVERNANCE |
Except
for information concerning the Company’s executive officers, which is included in Part I of this Annual Report, the information
required by Item 10 is incorporated by reference from the Company’s definitive proxy statement, expected to be filed with
the SEC on or before October 28, 2020 for the Company’s 2020 annual stockholders’
meeting.
| ITEM 11. |
EXECUTIVE COMPENSATION |
The
information required by Item 11 is incorporated herein by reference from the Company’s definitive proxy statement, expected
to be filed with the SEC on or before October 28, 2020 for the Company’s 2020
annual stockholders’ meeting.
| ITEM 12. |
SECURITY OWNERSHIP OF CERTAIN BENEFICIAL OWNERS AND MANAGEMENT AND RELATED STOCKHOLDER MATTERS |
Except
for the information below regarding our equity compensation plans, the information required by this Item 12 is incorporated herein
by reference from the Company’s definitive proxy statement, expected to be filed with the SEC on or before October
28, 2020 for the Company’s 2020 annual stockholders’ meeting.
The
following table provides information relating to our equity compensation plans as of June 30, 2020.
| Column A |
Column B |
Column C |
||||||||||
| Number of Securities to be Issued Upon Exercise of Outstanding Options, Warrants and Rights |
Weighted-Average Exercise Price of Outstanding Options, Warrants and Rights |
Number of Securities Remaining Available for Future Issuance under Equity Compensation Plans (Excluding Securities Reflected in Column A) |
||||||||||
| Equity compensation plans approved by stockholders |
– | $ | – | 390,000 | ||||||||
| ITEM 13. |
CERTAIN RELATIONSHIPS AND RELATED TRANSACTIONS AND DIRECTOR INDEPENDENCE |
The
information required by this Item 13 is incorporated herein by reference from the Company’s definitive proxy statement,
expected to be filed with the SEC on or before October 28, 2020 for the Company’s
2020 annual stockholders’ meeting.
| ITEM 14. |
PRINCIPAL ACCOUNTANT FEES AND SERVICES |
The
information required by this Item 14 is incorporated herein by reference from the Company’s definitive proxy statement,
expected to be filed with the SEC on or before October 28, 2020 for the Company’s
2020 annual stockholders’ meeting.
| ITEM 15. |
EXHIBITS AND FINANCIAL STATEMENT SCHEDULES |
| (a)(1) | Financial Statements |
The
following financial statements are included in Item 8 of Form 10-K:
| Report of Independent Registered Public Accounting Firm |
| Consolidated Balance Sheets as of June 30, 2020 and 2019 |
| Consolidated Statements of Operations for the years ended June 30, 2020, 2019 and 2018 |
| Consolidated Statements of Stockholders’ Equity for the years ended June 30, 2020, 2019 and 2018 |
| Consolidated Statements of Cash Flows for the years ended June 30, 2020, 2019 and 2018 |
| Notes to the Consolidated Financial Statements |
| (a)(2) | Financial Statement Schedule |
| Schedule II Valuation and Qualifying Accounts included in Item 8 of Form 10-K. |
| Other schedules are omitted because the required information is either inapplicable or has been disclosed in the consolidated financial statements and notes thereto. |
|
Please |
| * | Management contract or compensatory plan or arrangement |
| ** | Filed herewith. |
| † | Furnished herewith but not filed. |
Pursuant
to the requirements of Section 13 or 15(d) of the Securities Act of 1934, the registrant has duly caused this Annual Report to
be signed on its behalf by the undersigned thereunto duly authorized.
| COLLECTORS UNIVERSE, INC. |
||
| Date: August 26, 2020 |
By: |
/s/ JOSEPH J. WALLACE |
|
Joseph and |
||
POWER
OF ATTORNEY
Each
person whose signature to this Annual Report appears below hereby appoints Joseph J. Orlando and Joseph J. Wallace, and each of
them, individually, to act severally as attorneys-in-fact and agents, with power of substitution and resubstitution, for each
of the undersigned persons, to sign on his or her behalf, individually and in the capacities stated below, and to file, any and
all amendments to this Annual Report, which amendment or amendments may make changes and additions to this Annual Report as such
attorneys-in-fact or either of them may deem necessary or appropriate.
Pursuant
to the requirements of the Securities Exchange Act of 1934, this Annual Report has been signed by the following persons on behalf
of the Registrant and in the capacities and on the dates indicated.
| Signature | Title | Date | ||
| /s/ BRUCE A. STEVENS |
Chairman of the Board and Director |
August 26, 2020 |
||
| Bruce A. Stevens |
||||
| /s/ JOSEPH J. ORLANDO |
President, Chief Executive Officer and Director |
August 26, 2020 |
||
| Joseph J. Orlando |
(Principal Executive Officer) |
|||
| /s/ JOSEPH J. WALLACE |
Senior Vice President and Chief Financial Officer |
August 26, 2020 |
||
| Joseph J. Wallace |
(Principal Financial and Accounting Officer) |
|||
| /s/ DEBORAH A. FARRINGTON |
Director | August 26, 2020 |
||
| Deborah A. Farrington |
||||
| /s/ JOSEPH R. MARTIN |
Director | August 26, 2020 |
||
| Joseph R. Martin |
||||
| /s/ A.J. BERT MOYER |
Director | August 26, 2020 |
||
| A.J. Bert Moyer |
Exhibit
4
DESCRIPTION
OF THE COMPANY’S COMMON STOCK
DESCRIPTION
OF CAPITAL STOCK
Authorized
Capital Stock
The
authorized capital stock of Collectors Universe, Inc. (the “Company”) consists of 20,000,000 shares of common stock,
par value 0.001 per share, and 3,000,000 shares of preferred stock, $0.001 par value per share.
As
of August 21, 2020, total of 9,239,911 shares of common stock were outstanding, but no shares of preferred stock were outstanding.
All of the outstanding shares of common stock are fully paid and nonassessable.
The
Board of Directors may authorize the issuance of additional shares of common stock or preferred stock without a vote of the stockholders,
subject to voting rights, if any, of the holders of any series of preferred shares that may be outstanding prior to the Board’s
authorization of the issuance of additional shares of preferred shares.
Description
of Common Stock
Holders
of Company common stock are entitled to one vote per share on all matters to be voted on by the stockholders. Subject to preferences
that may be applicable to the holders of outstanding shares of preferred stock, if any, the holders of common stock are entitled
to receive such dividends out of funds legally available at the times and in the amounts that our Board of Directors may determine.
All of the holders of the outstanding shares of our common stock have the same powers, preferences and rights and rank equally,
share ratably and are identical in all respects as to all matters. In the event of liquidation, dissolution or winding up of the
Company, subject to the rights of the holders of outstanding shares of preferred stock, if any, the holders of shares of common
stock shall be entitled to receive all of the remaining assets of the Company available for distribution to its stockholders after
satisfaction of all its liabilities and the payment of any liquidation preference of any outstanding preferred stock. There are
no redemption or sinking fund provisions applicable to the common stock.
The
holders of the outstanding shares of our common stock do not have the ability to cumulate votes in the election of directors.
As a result, nominees standing for election to the Board, at a meeting of the Company’s stockholders, who receive a plurality
of the votes cast in the election of directors will be elected, subject to a “majority vote” standard that has been
adopted by the Board. Pursuant to that majority vote standard, if any nominee for election to the Board fails to receive a majority
of the votes cast in an uncontested election, the nominee will be required to submit an offer of resignation to the Board, which
will have the right, in its discretion, to accept or reject that offer of resignation. If the Board accepts the resignation, it
may either correspondingly reduce the authorized number of directors or appoint another person to fill the vacancy created by
the resignation. If the Board decides, instead, to reject the resignation, then, the nominee would continue to serve as a director
until the next annual stockholders meeting and, in that event, the Board would be required to publicly disclose the reasons why
it decided to reject the resignation of the nominee.
Preferred
Stock
Pursuant
to the terms of our amended and restated certificate of incorporation, our Board of Directors will be authorized, subject to any
limitations that may be prescribed by Delaware law, to issue up to 3,000,000 shares of our preferred stock, in one or more series,
to establish from time to time the number of shares to be included in each series, and to fix the designation, powers, preferences
and rights of the shares of each series and any of its qualifications, limitations or restrictions, in each case without further
action by our stockholders. The issuance of preferred stock, while providing flexibility in connection with possible financings,
acquisitions and other corporate purposes, could, among other things, have the effect of delaying, deterring or preventing a change
of control of the Company and could adversely affect the market price of our common stock and the voting and other rights of the
holders of our common stock.
Anti-Takeover
Provisions of Delaware Law, Our Amended and Restated Certificate of Incorporation and our Amended and Restated Bylaws
Certain
provisions of Delaware law, our amended and restated certificate of incorporation and our amended and restated bylaws may have
the effect of delaying, deterring or preventing another person or group of persons from acquiring control of the Company, or removing
incumbent directors and officers. These provisions are expected to discourage certain types of coercive takeover practices and
takeover bids that our Board may consider inadequate and to encourage any person or group seeking to acquire control of the Company
to first negotiate with our Board. We believe the benefits of increased protection of our ability to negotiate with the proponent
of an unsolicited proposal to acquire the Company or remove our incumbent directors and officers, outweighs the disadvantages
of discouraging these proposals because, among other things, negotiation of these proposals could result in an improvement of
their terms and potential benefits to our stockholders.
The
provisions of our Amended and Restated Certificate of Incorporation and our Amended and Restated Bylaws (our “Bylaws”)
contain anti-takeover provisions, including those listed below, that could make it more difficult for a third party to acquire
control of the Company, even if that change of control would be beneficial to our stockholders:
| ● | our Board of Directors has the authority to issue additional shares of common stock and shares of preferred stock and to determine the price, rights and preferences of any new series of preferred stock without stockholder approval; |
|
| ● | there are limitations on who can call special meetings of our stockholders; |
|
| ● | stockholders may not take action by written consent; and |
|
| ● | our Bylaws contain advance notice requirements, which provide that a stockholder seeking to nominate one or more persons for election to the Board or to submit a proposal of business to be considered by the stockholders, at any upcoming annual stockholders’ meeting, must provide a written notice to the Company containing certain information about the business experience and qualifications of the stockholder’s nominees or about the proposal, by no later than 120 calendar days in advance of the first anniversary of the date on which the Company’s proxy statement for the prior year’s annual meeting was released to stockholders. |
In
addition, provisions of Delaware law and provisions of our stock incentive plans and employment agreements with any executive
officer or other key management employee, also may discourage, delay or prevent a change in control of the Company or unsolicited
acquisition proposal, including Section 203 of the Delaware law. That Section prevents some Delaware corporations from engaging,
under certain circumstances, in a business combination, which includes a merger or sale of at least 10% of the corporation’s
assets, with any “interested stockholder”, meaning a stockholder who, together with its affiliates and associates,
owns or, within three years prior to the determination of interested stockholder status, did own 15% or more of the Company’s
outstanding voting stock, unless:
| ● | the transaction is approved by the Board of Directors prior to the time that the interested stockholder became an interested stockholder; |
|
| ● | upon consummation of the transaction that results in the stockholder becoming an interested stockholder, that owned at least 85% of the voting stock of the corporation outstanding at the time the transaction commenced; or |
|
| ● | to such time that the stockholder became an interested stockholder, the business combination is approved by the board of directors and authorized at an annual or special meeting of stockholders by at least two-thirds of the outstanding voting stock which is not owned by the interested stockholder. |
These
provisions might also have the effect of preventing changes in our management. It is also possible that these provisions could
make it more difficult to accomplish transactions that stockholders might otherwise deem to be in their best interests.
Our
Bylaws also contain a provision that designates the Court of Chancery of the State of Delaware (or, if the Court of Chancery lacks
subject matter jurisdiction, any state or federal court located within the State of Delaware) as the sole and exclusive forum
for: (i) any derivative action or proceeding brought on behalf of the Company, (ii) any action or proceeding asserting a claim
of breach of a fiduciary duty or any action, (iii)any action or proceeding asserting a claim against the Company or any of its
directors, officers or other employees arising pursuant to, or seeking to enforce any right or remedy under, any provision of
the Delaware General Company Law, the Company’s Certificate of Incorporation or these Bylaws (in each case, as they may
be amended from time to time), (iv) any action or proceeding asserting a claim against the Company or any of its directors, officers
or other employees of the Company governed by the internal affairs doctrine, or (v) any action or proceeding to interpret, apply,
enforce, or determine the validity or scope of any provision or provisions of the Company’s Certificate of Incorporation
or these Bylaws (in each case, as they may be amended from time to time), in all cases to the full extent permitted by applicable
law and subject to the court’s having personal jurisdiction over the indispensable parties named as defendants.
Exhibit
21.1
SUBSIDIARIES
OF REGISTRANT
| Name |
State / Country of Incorporation/Organization |
Collectors Universe Ultimate Ownership |
||
| Certified Asset Exchange, Inc. | Delaware | 100% | ||
| Expos Unlimited, LLC | California | 100% | ||
| Collectors Universe (Hong Kong) Limited | Hong Kong | 100% | ||
| Collectors Universe (Shanghai) Limited | China | 100% | ||
| Collectors Universe (Japan) Limited Japan | Japan | 100% |
In
accordance with the instructions set forth in Paragraph (b) of Item 601 of Regulation S-K, there has been omitted those subsidiaries
that, if considered in the aggregate as a single subsidiary, would not constitute a significant subsidiary as of June 30, 2020.
Exhibit
23.1
CONSENT
OF INDEPENDENT REGISTERED PUBLIC ACCOUNTING FIRM
We
have issued our report dated August 26, 2020, with respect to the consolidated financial statements in the Annual Report of Collectors
Universe, Inc. on Form 10-K for the year ended June 30, 2020. We consent to the incorporation by reference of said report in the
Registration Statements of Collectors Universe, Inc. on Forms S-8 (File No. 333-222961, effective February 9, 2018 and
File No. 333-193092, effective December 26, 2013) and on Form S-3 (File No. 333-177270, effective October 12, 2011).
/s/
GRANT THORNTON LLP
Newport
Beach, California
August
26, 2020
Exhibit
31.1
CERTIFICATIONS
OF CHIEF EXECUTIVE OFFICER
UNDER
SECTION
302 OF THE SARBANES-OXLEY ACT
I,
Joseph J. Orlando, certify that:
| 1. | I have reviewed this Annual Report on Form 10-K of Collectors Universe, Inc. for the year ended June 30, 2020; |
| 2. | Based on my knowledge, this Annual Report does not contain any untrue statement of a material fact or omit to state a material fact necessary to make the statements made, in light of the circumstances under which such statements were made, not misleading with respect to the period covered by this Annual Report; |
| 3. | Based on my knowledge, the financial statements, and other financial information included in this Annual Report, fairly present in all material respects the financial condition, results of operations and cash flows of the registrant as of, and for, the periods presented in this Annual Report; |
| 4. | The registrant’s other certifying officer and I are responsible for establishing and maintaining disclosure controls and procedures (as defined in Exchange Act Rules 13a-15(e) and 15d-15(e)) and internal control over financial reporting (as defined in Exchange Act Rules 13a-15(f) and 15d-15(f)) for the registrant and have: |
| (a) | designed such disclosure controls and procedures, or caused such disclosure controls and procedures to be designed under our supervision, to ensure that material information relating to the registrant, including its consolidated subsidiaries, is made known to us by others within those entities, particularly during the period in which this Annual Report is being prepared; |
|
| (b) | designed such internal control over financial reporting, or caused such internal control over financial reporting to be designed under our supervision, to provide reasonable assurance regarding the reliability of financial reporting and the preparation of financial statements for external purposes in accordance with generally accepted accounting principles; |
|
| (c) | evaluated the effectiveness of the registrant’s disclosure controls and procedures and presented in this Report our conclusions about the effectiveness of the disclosure controls and procedures as of the end of the period covered by this Annual Report based on such evaluation; and |
|
| (d) | disclosed in this Annual Report any change in the registrant’s internal control over financial reporting that occurred during the registrant’s most recent fourth fiscal quarter that has materially affected, or is reasonably likely to materially affect, the registrant’s internal control over financial reporting; and |
| 5. | The registrant’s other certifying officer and I have disclosed, based on our most recent evaluation of internal control over financial reporting, to registrant’s auditors and the audit committee of registrant’s board of directors (or persons performing the equivalent functions): |
| (a) | all significant deficiencies and material weaknesses in the design or operation of internal control over financial reporting which are reasonably likely to adversely affect the registrant’s ability to record, process, summarize and report financial information; and |
|
| (b) | any fraud, whether or not material, that involves management or other employees who have a significant role in the registrant’s internal control over financial reporting. |
| Date: August 26, 2020 |
/s/ JOSEPH J. ORLANDO |
|
| Joseph J. Orlando |
||
| President and Chief Executive Officer |
Exhibit
31.2
CERTIFICATIONS
OF CHIEF FINANCIAL OFFICER
UNDER
SECTION
302 OF THE SARBANES-OXLEY ACT
I,
Joseph J. Wallace, certify that:
| 1. | I have reviewed this Annual Report on Form 10-K of Collectors Universe, Inc. for the year ended June 30, 2020; |
| 2. | Based on my knowledge, this Report does not contain any untrue statement of a material fact or omit to state a material fact necessary to make the statements made, in light of the circumstances under which such statements were made, not misleading with respect to the period covered by this Annual Report; |
| 3. | Based on my knowledge, the financial statements, and other financial information included in this Annual Report, fairly present in all material respects the financial condition, results of operations and cash flows of the registrant as of, and for, the periods presented in this Annual Report; |
| 4. | The registrant’s other certifying officer and I are responsible for establishing and maintaining disclosure controls and procedures (as defined in Exchange Act Rules 13a-15(e) and 15d-15(e)) and internal control over financial reporting (as defined in Exchange Act Rules 13a-15(f) and 15d-15(f)) for the registrant and have: |
| (a) | designed such disclosure controls and procedures, or caused such disclosure controls and procedures to be designed under our supervision, to ensure that material information relating to the registrant, including its consolidated subsidiaries, is made known to us by others within those entities, particularly during the period in which this Annual Report is being prepared; |
|
| (b) | designed such internal control over financial reporting, or caused such internal control over financial reporting to be designed under our supervision, to provide reasonable assurance regarding the reliability of financial reporting and the preparation of financial statements for external purposes in accordance with generally accepted accounting principles; |
|
| (c) | evaluated the effectiveness of the registrant’s disclosure controls and procedures and presented in this Report our conclusions about the effectiveness of the disclosure controls and procedures as of the end of the period covered by this Annual Report based on such evaluation; and |
|
| (d) | disclosed in this Annual Report any change in the registrant’s internal control over financial reporting that occurred during the registrant’s most recent fourth fiscal quarter that has materially affected, or is reasonably likely to materially affect, the registrant’s internal control over financial reporting; and |
| 5. | The registrant’s other certifying officer and I have disclosed, based on our most recent evaluation of internal control over financial reporting, to registrant’s auditors and the audit committee of registrant’s board of directors (or persons performing the equivalent functions): |
| (a) | all significant deficiencies and material weaknesses in the design or operation of internal control over financial reporting which are reasonably likely to adversely affect the registrant’s ability to record, process, summarize and report financial information; and |
|
| (b) | any fraud, whether or not material, that involves management or other employees who have a significant role in the registrant’s internal control over financial reporting. |
| Date: August 26, 2020 |
/s/ JOSEPH J. WALLACE |
|
| Joseph J. Wallace |
||
| Senior Vice President and Chief Financial Officer |
Exhibit
32.1
COLLECTORS
UNIVERSE, INC.
Annual
Report on Form 10-K
for
the Year Ended June 30, 2020
CERTIFICATION
OF PERIODIC REPORT
Pursuant
to Section 906 of the Sarbanes-Oxley Act of 2002
The
undersigned, who is the Chief Executive Officer of Collectors Universe, Inc. (the “Company”), hereby certifies that
(i) the Annual Report on Form 10-K for the year ended June 30, 2020, as filed by the Company with the Securities and Exchange
Commission (the “Report”), to which this Certification is an Exhibit, fully complies with the applicable requirements
of Section 13(a) and 15(d) of the Exchange Act; and (ii) the information contained in this Report fairly presents, in all material
respects, the financial condition and results of operations of the Company.
| Date: August 26, 2020 |
/s/ JOSEPH J. ORLANDO |
|
| Joseph J. Orlando |
||
| President and Chief Executive Officer |
||
| A signed original of this written statement required by Section 906 has been provided to Collectors Universe, Inc. and will be retained by Collectors Universe, Inc. and furnished to the Securities and Exchange Commission or its staff upon request. |
Exhibit
32.2
COLLECTORS
UNIVERSE, INC.
Annual
Report on Form 10-K
for
the Year Ended June 30, 2020
CERTIFICATION
OF PERIODIC REPORT
Pursuant
to Section 906 of the Sarbanes-Oxley Act of 2002
The
undersigned, who is the Chief Financial Officer of Collectors Universe, Inc. (the “Company”), hereby certifies that
(i) the Annual Report on Form 10-K for the year ended June 30, 2020, as filed by the Company with the Securities and Exchange
Commission (the “Report”), to which this Certification is an Exhibit, fully complies with the applicable requirements
of Section 13(a) and 15(d) of the Exchange Act; and (ii) the information contained in this Report fairly presents, in all material
respects, the financial condition and results of operations of the Company.
| Date: August 26, 2020 |
/s/ JOSEPH J. WALLACE |
|
| Joseph J. Wallace |
||
| Senior Vice President and Chief Financial Officer |
||
| A signed original of this written statement required by Section 906 has been provided to Collectors Universe, Inc. and will be retained by Collectors Universe, Inc. and furnished to the Securities and Exchange Commission or its staff upon request. |


