
Bitcoin (BTC)
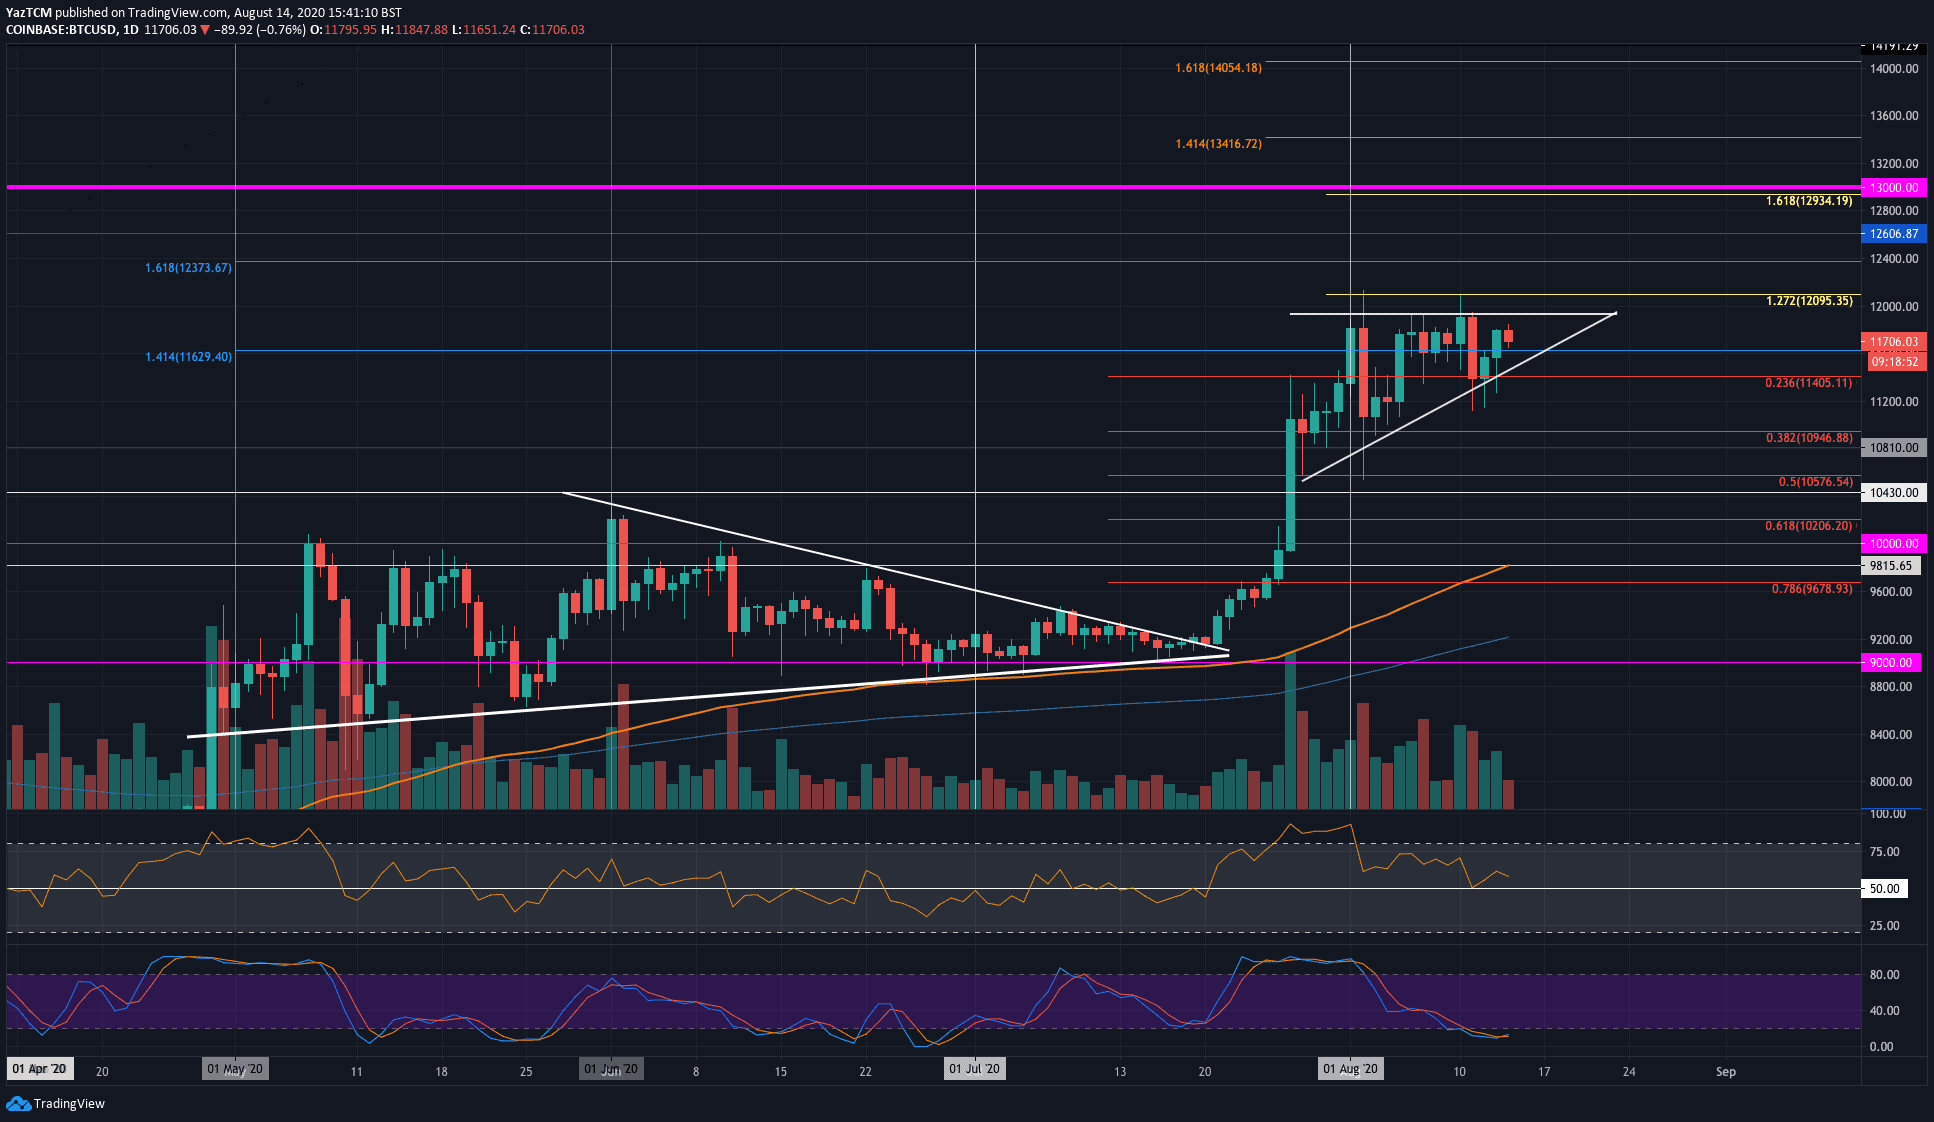
Bitcoin is more or less around the price it was traded a week ago, but this comes after a raging week as the coin plunged to a weekly low around $11,100.
Shortly before, Bitcoin made another push towards the current high at $12,100 (1.272 Fib Extension), for the second time in 10 days. Unfortunately, BTC was unable to sustain this high.
Just one day after, Bitcoin lost almost $1000, however quickly recovered to the support level around $11,400 (.236 Fib Retracement and prior high). It also rebounded at a rising trend line that has been in play since late-July. This trend line constitutes the lower boundary of a short term ascending triangle that has formed.
Bitcoin price rebounded from this rising trend line on Wednesday, which allowed it to push to the current $11,700 – $11,800 level.
Looking ahead, if the buyers push higher, the first level of resistance lies at the upper boundary of the triangle at $11,900. This level is followed by resistance at $12,000 and $12,100 (1.272 Fib Extension, along with the 2020 high). Additional resistance lies at $12,400.
Failing to obtain above the $12,100 level might result in a bearish reversal pattern – a Double Top formation.
On the other side, the first level of support lies at the rising trend line. Beneath this, support is found at $11,400 (.236 Fib Retracement), $11,100 (the week’s low), $11,000, and $10,810.
Ethereum (ETH)
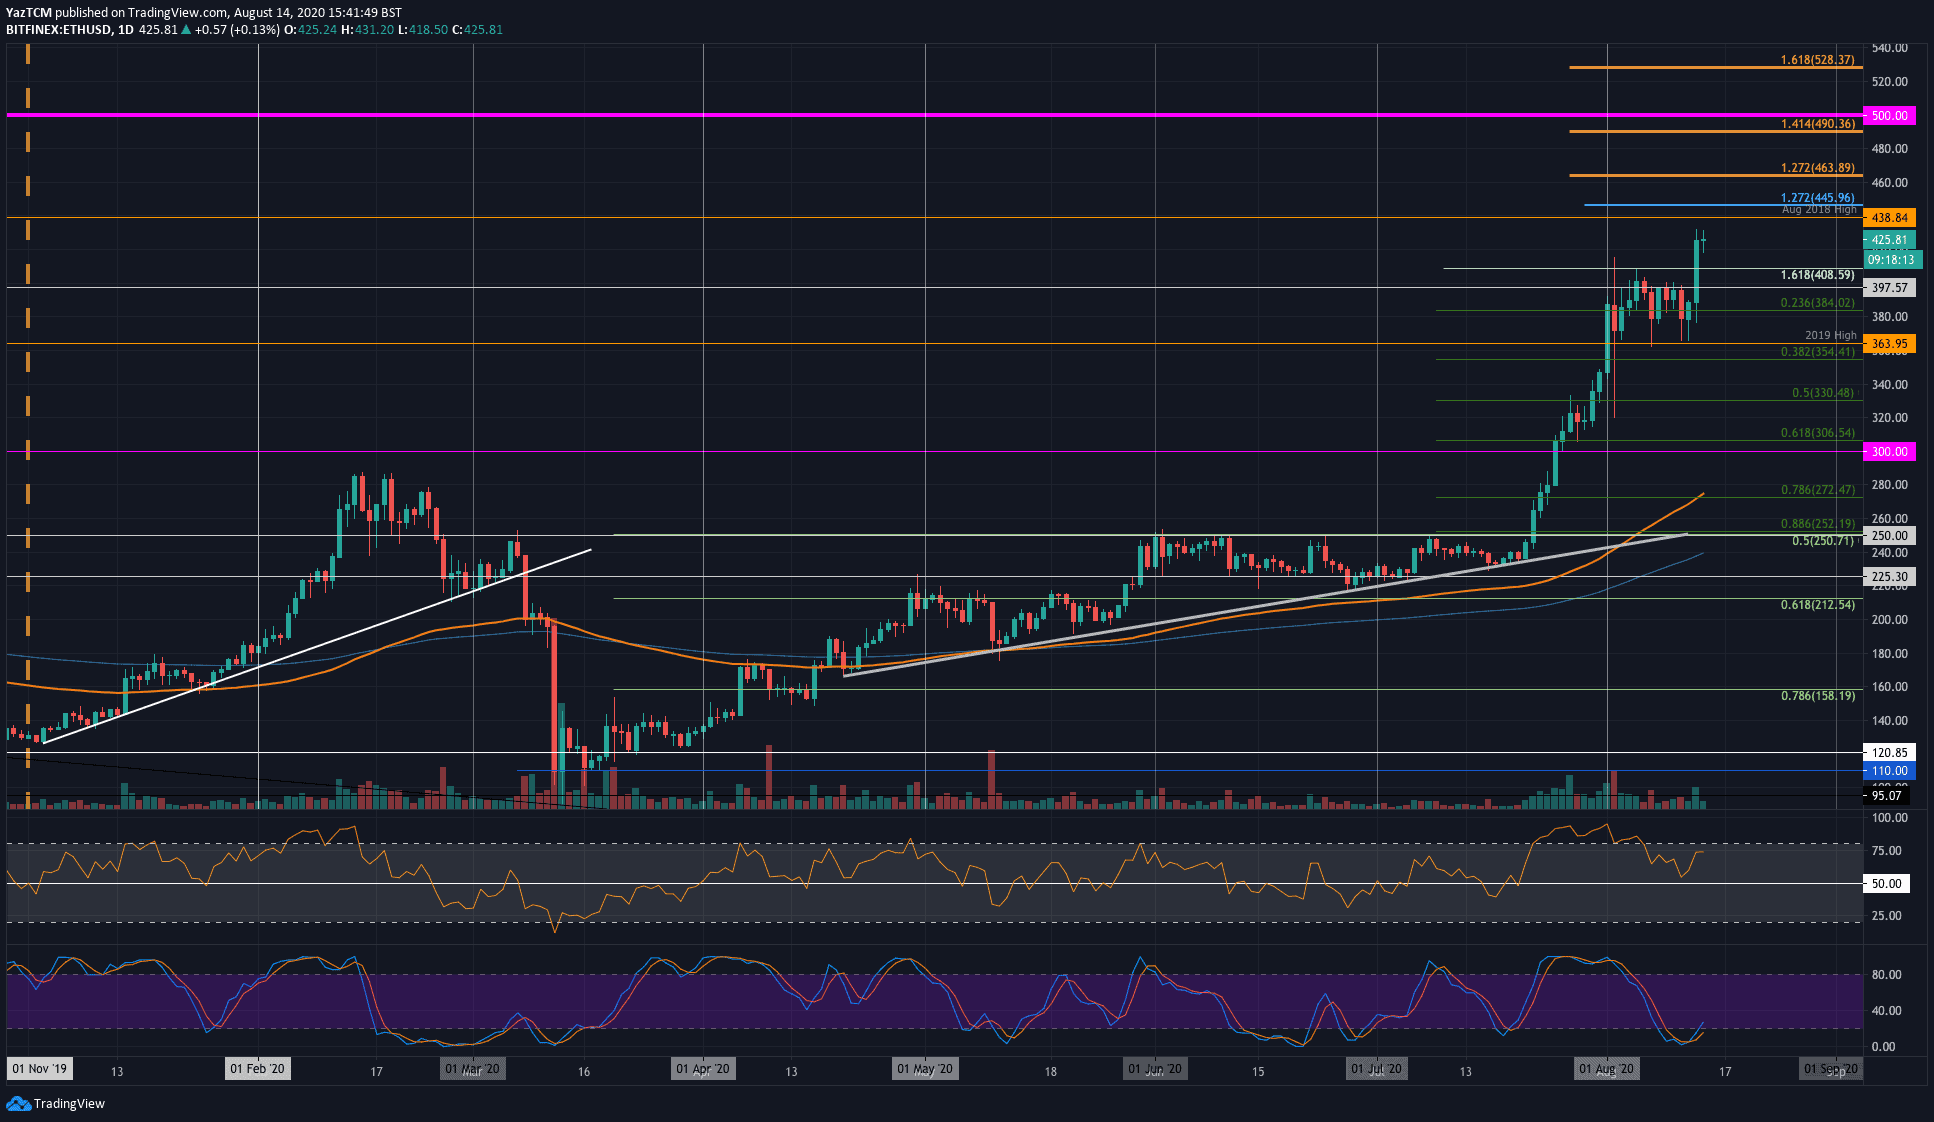
Ethereum saw a substantial 15% price surge this week, which elevated ETH, reaching over $440 as of writing these lines. Before yesterday’s break above $400, Ethereum was trapped in a range between $363 and $408 during the first two weeks of August.
The coin started this week by trading at the $380 level. From there, it pushed higher but met resistance at $400, which caused it to roll over, together with Bitcoin’s decline towards $11K. Luckily, it found support at $365 (2019 high) and rebounded.
After bouncing, ETH went on to surge above the $400 resistance as it climbed to the current $440 – $450 level. This break above $400 now puts Ethereum at near 2-year highs as it surpassing the August 2018 high at $438.
Looking ahead, if the buyers push higher, the first level of resistance to overcome lies at $438 (August 2019 high). This is followed by resistance at $445 (1.272 Fib Extension), $463 (1.272 Fib Extension), and $480.
On the other side, the first significant level of support is located at $400. Beneath this, additional support lies at $382 (.236 Fib Retracement), $364 (2019 High), and $355 (.382 Fib Retracement).
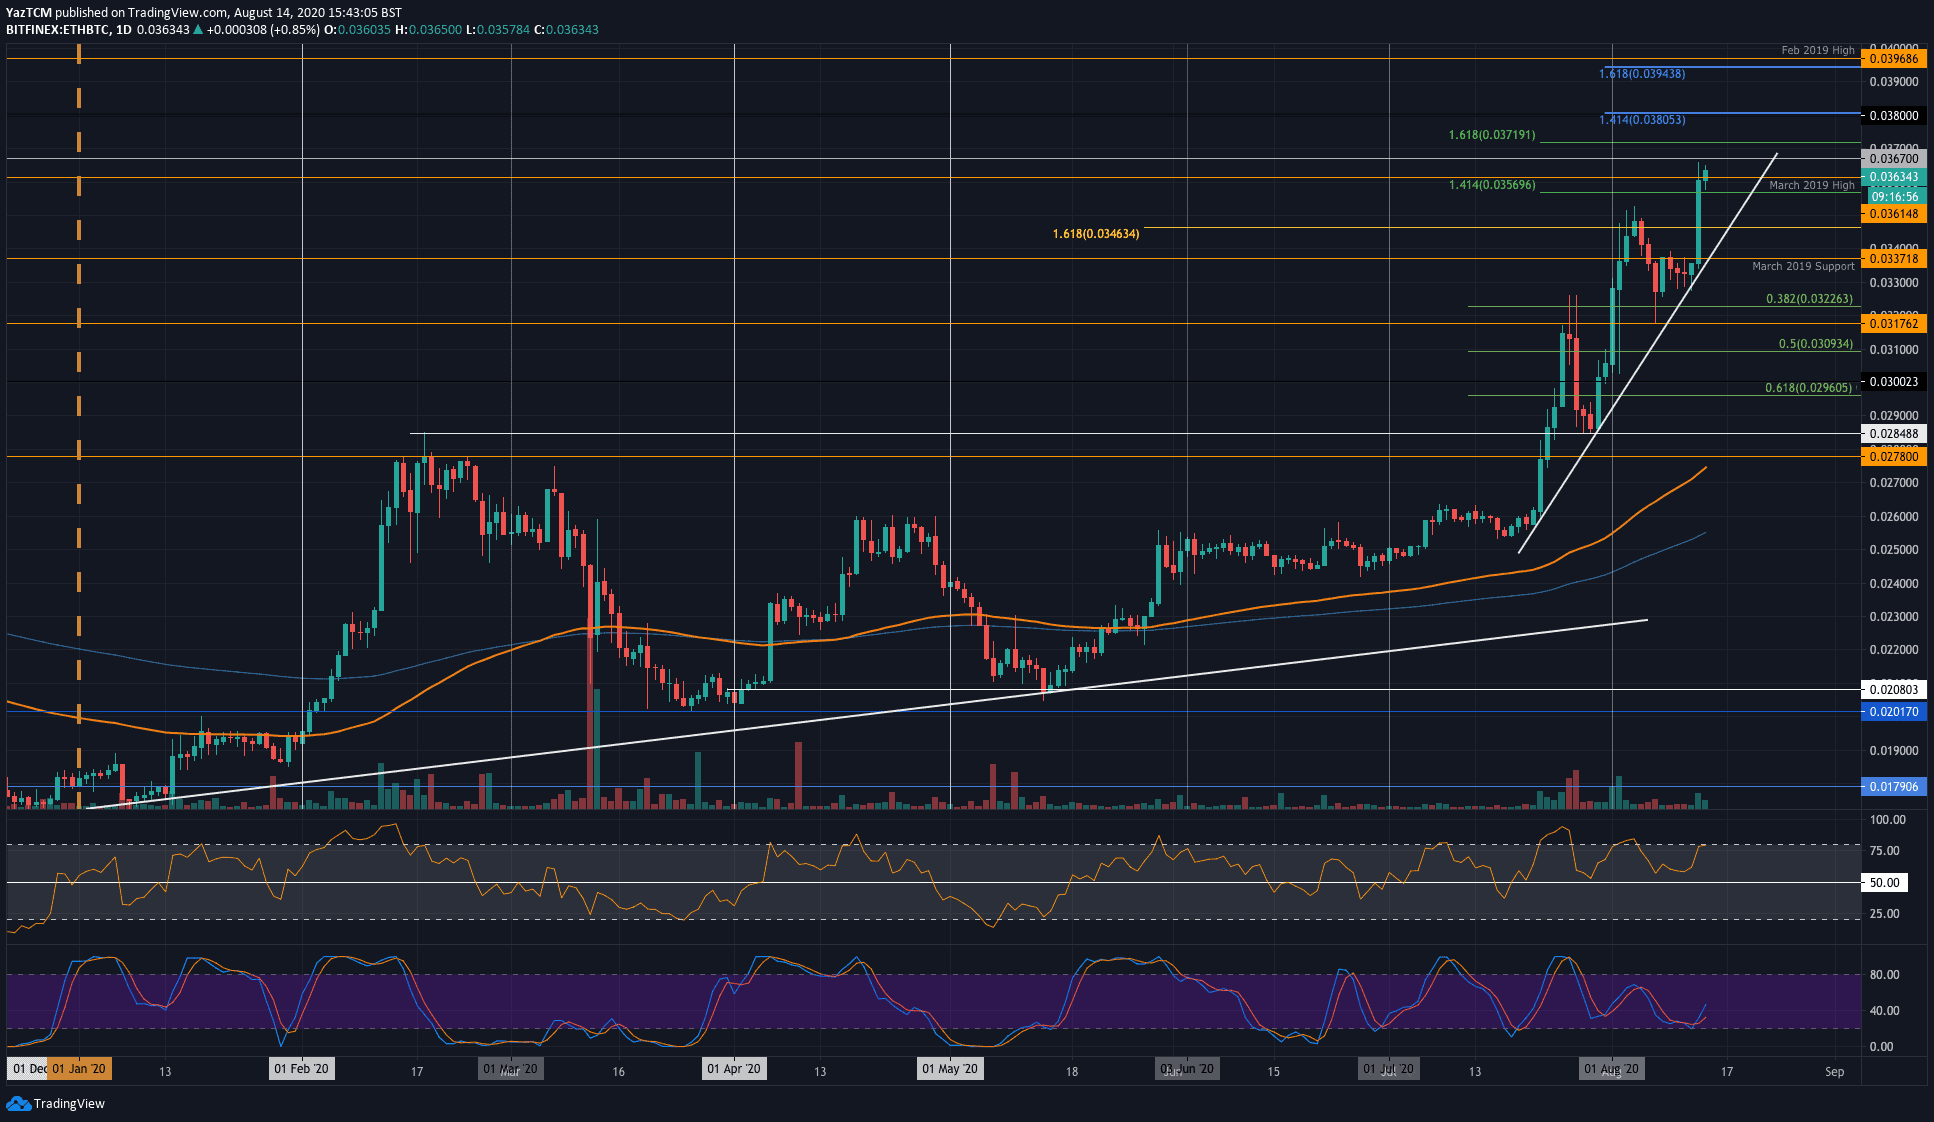
Against Bitcoin, Ethereum reached an 18-month high today as the coin broke above the March 2019 high at 0.0361 BTC to reach above the 0.037 BTC level. ETH/BTC started this week by trading at the 0.0326 BTC level. From there, it pushed higher but struggled to break the March 2019 support (now resistance) at 0.0337 BTC.
It took a total of 5-days for this resistance to break. ETH rebounded from a rising trend line which allowed it to push higher and break above the resistance mentioned above. It continued from there to almost reach above 0.037 BTC as of now.
Looking ahead, the next level of resistance lies at 0.0371 BTC (1.618 Fib Extension). This is followed by resistance at 0.038 BTC, 0.0394 BTC, and 0.0396 BTC (Feb 2019 high).
On the other side, the first level of support lies at 0.0362 BTC. This is followed by support at 0.0337 BTC (March 2019 Support) and 0.033 BTC.
Ripple (XRP)
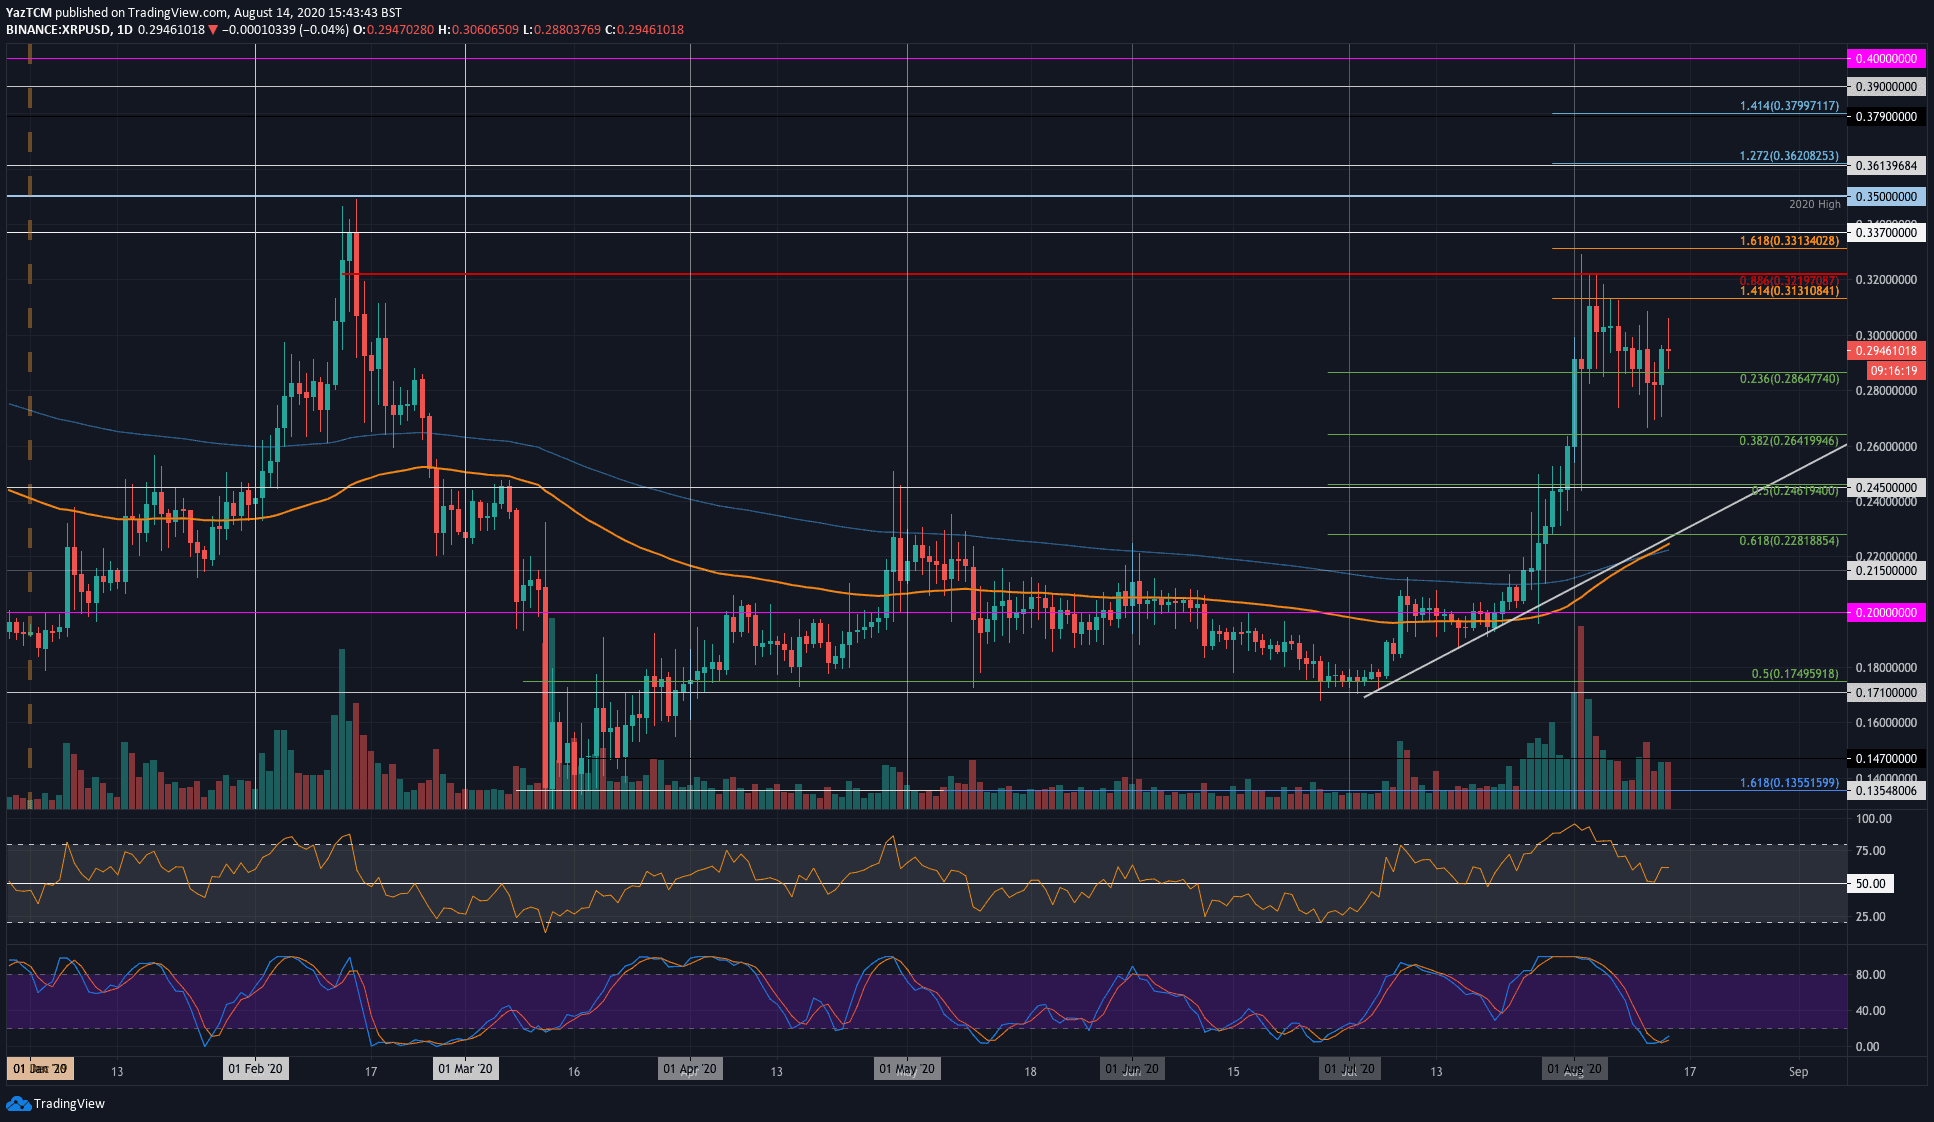
Despite a 6% price increase today, XRP is still down by 1.5% over this past week. The coin started the week by trading slightly beneath the $0.30 level. From there, it did attempt to push upward as it reached as high as $0.31, however, it was never able to close above $0.3 throughout the past week on the daily.
As the week progressed, it started to slowly grind lower as it found the initial support at $0.286 (.236 Fib Retracement). This support did not hold, which caused XRP to fall into the $0.28 support. It rebounded at this support to trade at the current $0.295 level today.
Regardless of this bounce higher, it is apparent that Ripple has been making lower highs and lower lows during August thus far.
Looking ahead, if the buyers can break the initial resistance at $0.30, additional resistance is expected at $0.313 (1.414 Fib Extension), $0.321 (bearish .886 Fib Retracement), and $0.331 (1.618 Fib Extension).
On the other side, the first level of support lies at $0.286 (.236 Fib Retracement). This is followed by support at $0.28 and $0.265 (.382 Fib Retracement).
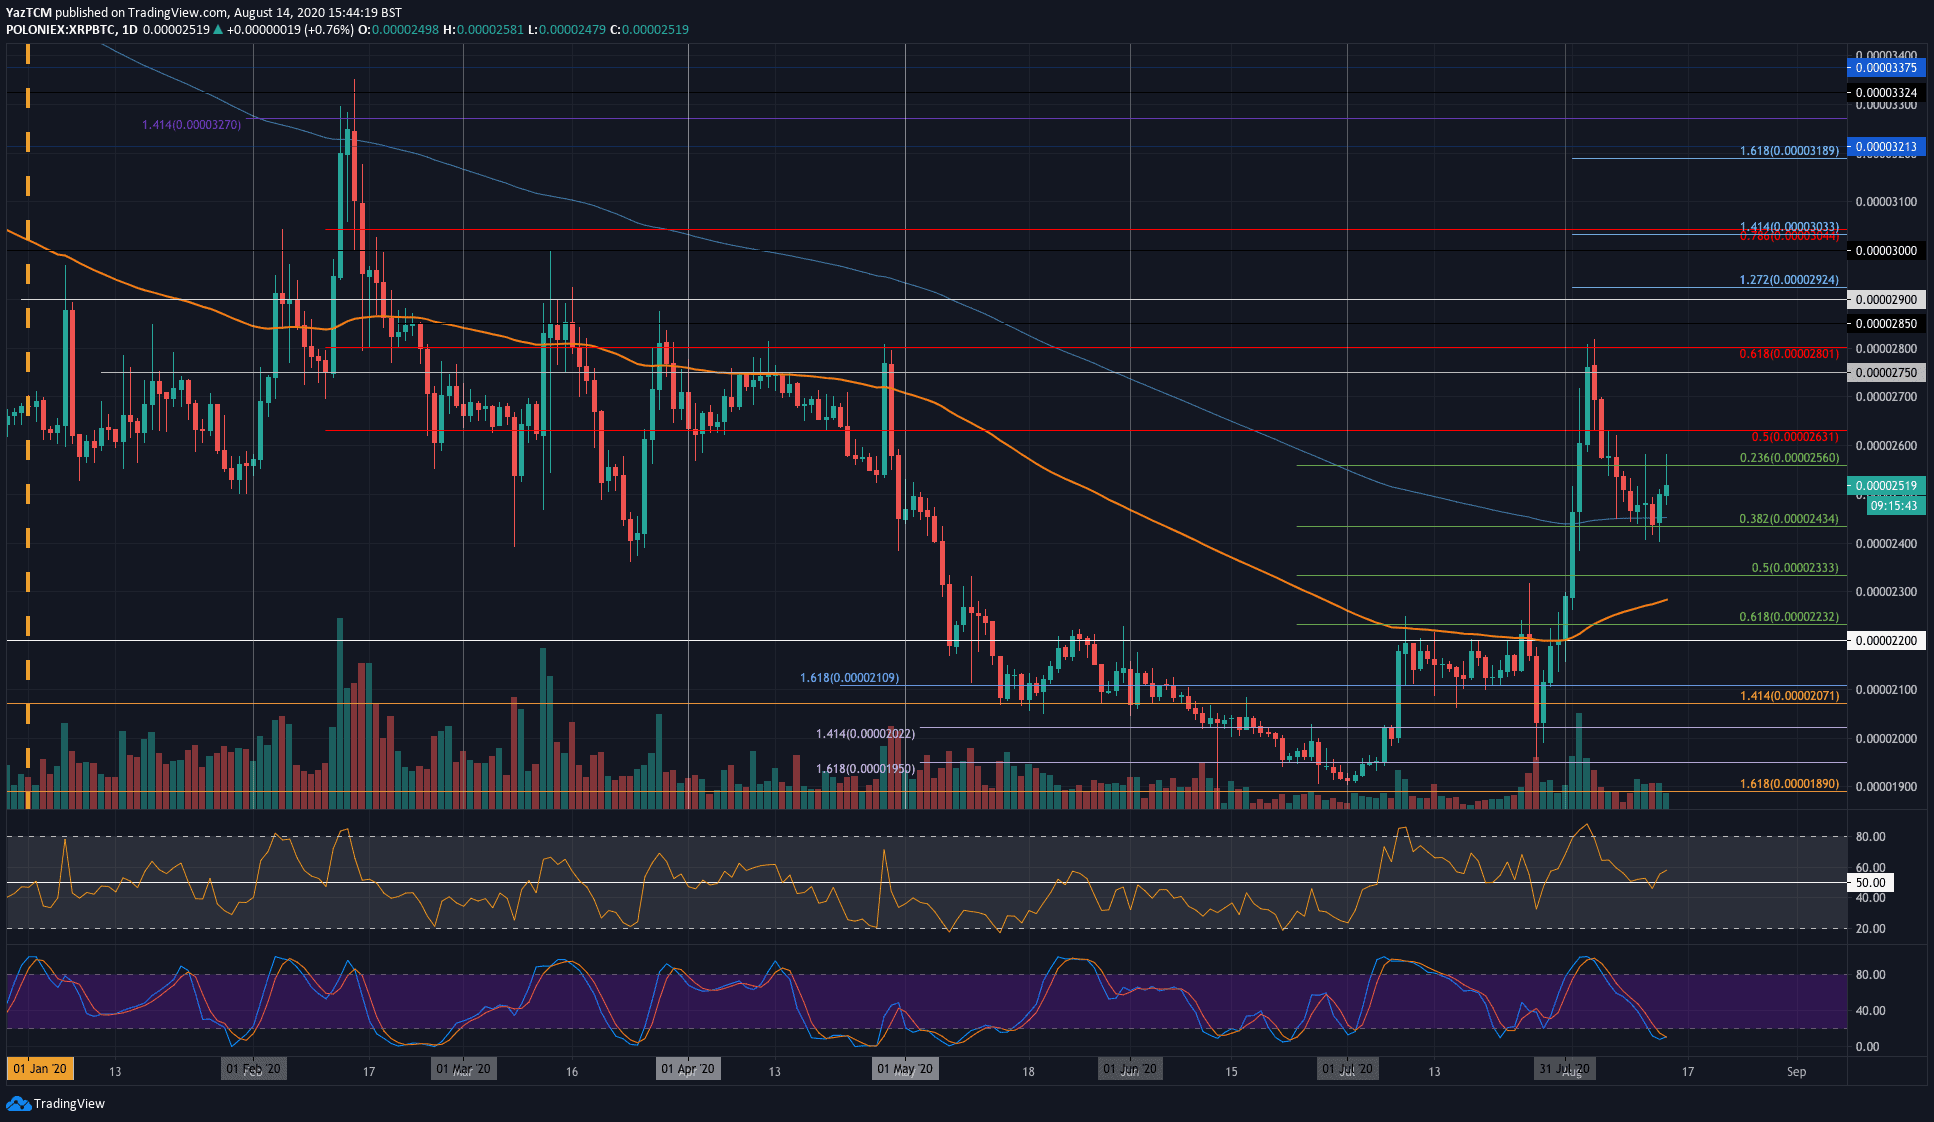
Against Bitcoin, XRP experienced a similar scenario as it dropped by a small 1.5% from the price 7-days ago. Throughout the week, XRP fell lower from 2540 SAT to reach as low as 2435 SAT where it found support at a .382 Fib Retracement. This support was further bolstered by a 200-days EMA in the same location.
XRP rebounded from this support over the past 3-days and as reached the current 2520 SAT level.
Looking ahead, if the bulls push higher, the first level of resistance lies at 2560 SAT. This is followed by resistance at 2630 SAT (bearish .5 Fib Retracement), 2700 SAT, and 2750 SAT.
On the other side, the first level of strong support lies at 2435 (.382 Fib Retracement). This is followed by support at 2335 SAT (.5 Fib Retracement) and 2300 SAT (100-days EMA).
Chainlink (LINK)
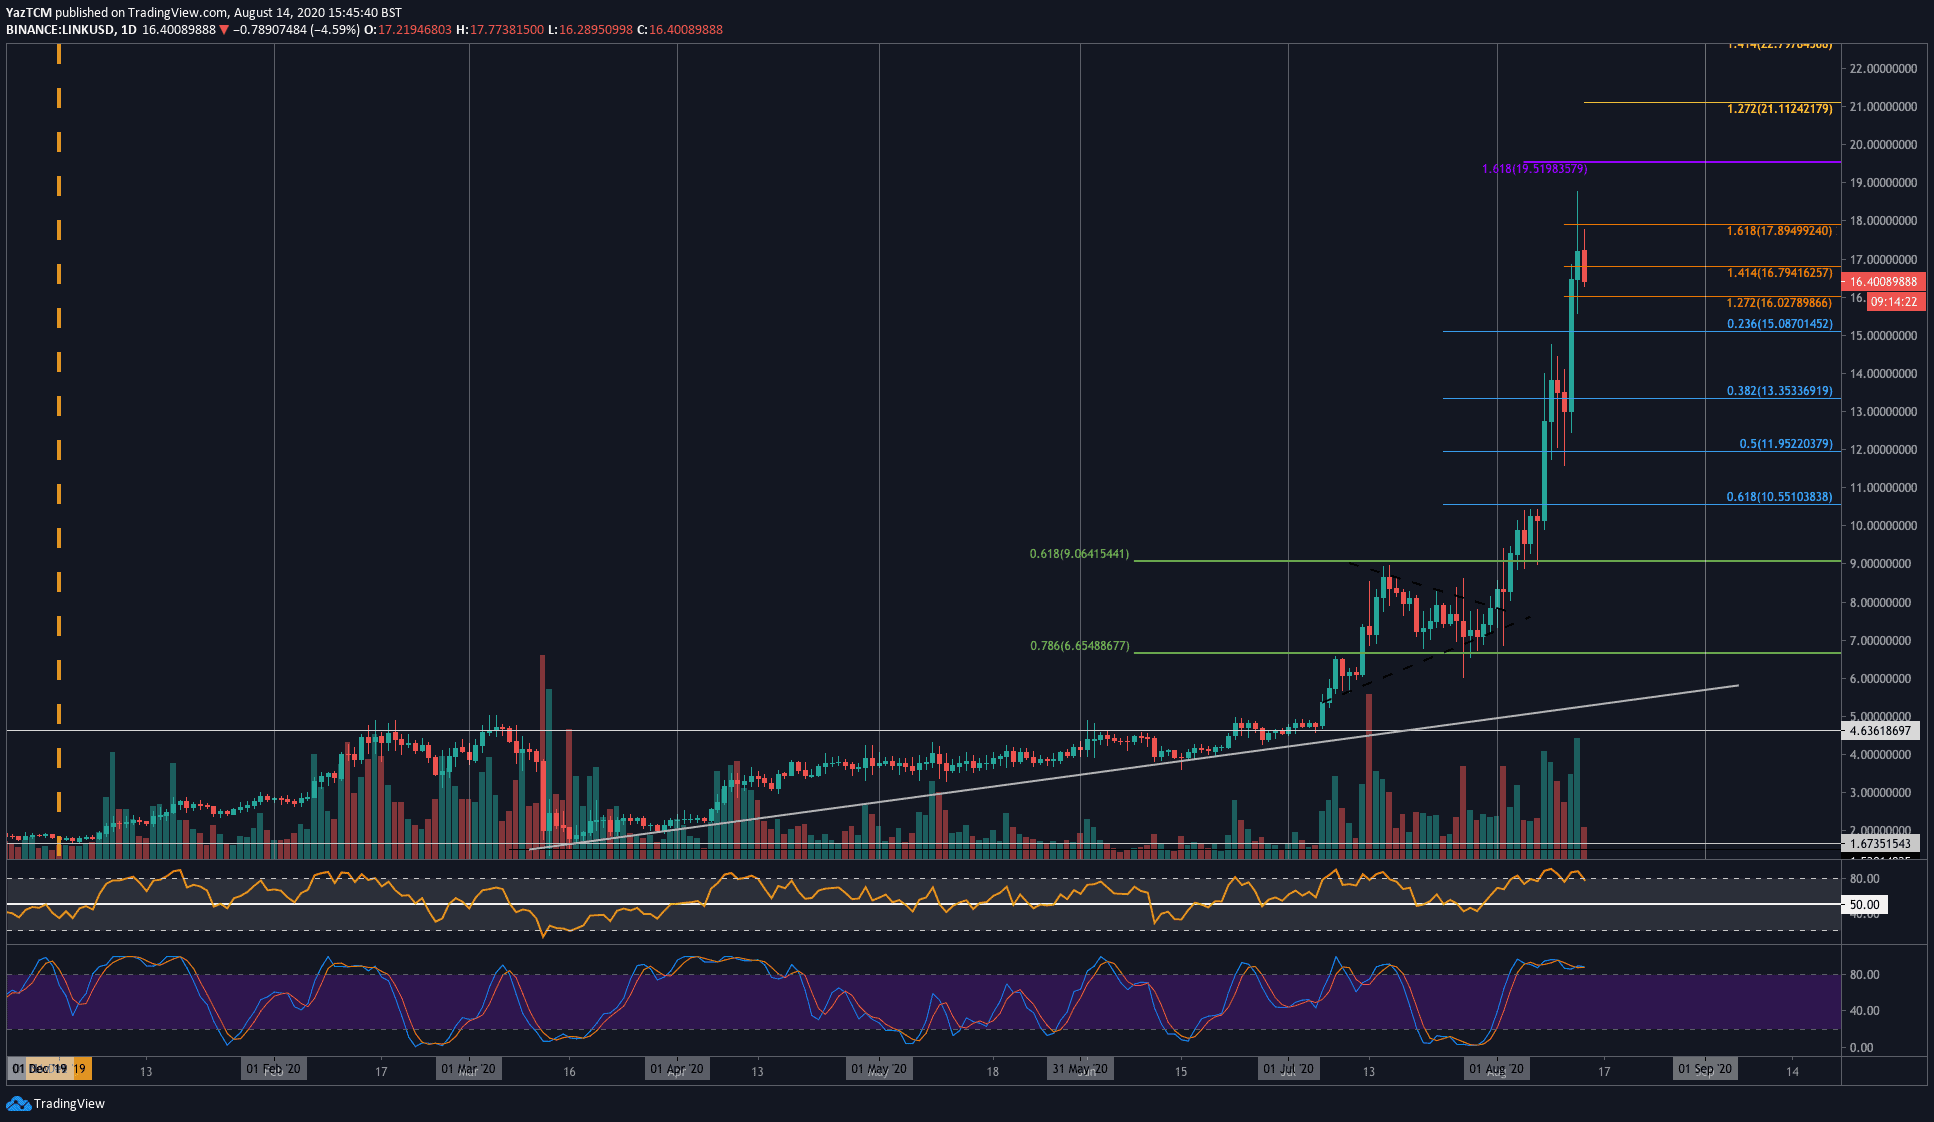
Chainlink experienced an epic 70% price explosion over this past week alone. The coin started the week beneath the $10 level as it started to push higher from there. LINK then went on to surge as high as $18.77 – creating another fresh ATH price.
Chainlink quickly dropped from this high as it was unable to close the day above the $17 level. The coin has since fallen slightly as it trades around $16.40.
Looking ahead, if the buyers can regroup and push LINK higher again, the first level of resistance to overcome lies at $17. This is followed by resistance at $17.90 (1.618 Fib Extension), $18.50, and $19.50 (1.618 Fib Extension – purple).
On the other side, the first level of support lies at $16. This is followed by support at $15.10 (.236 Fib Retracement), $14, and $13.35 (.382 Fib Retracement).
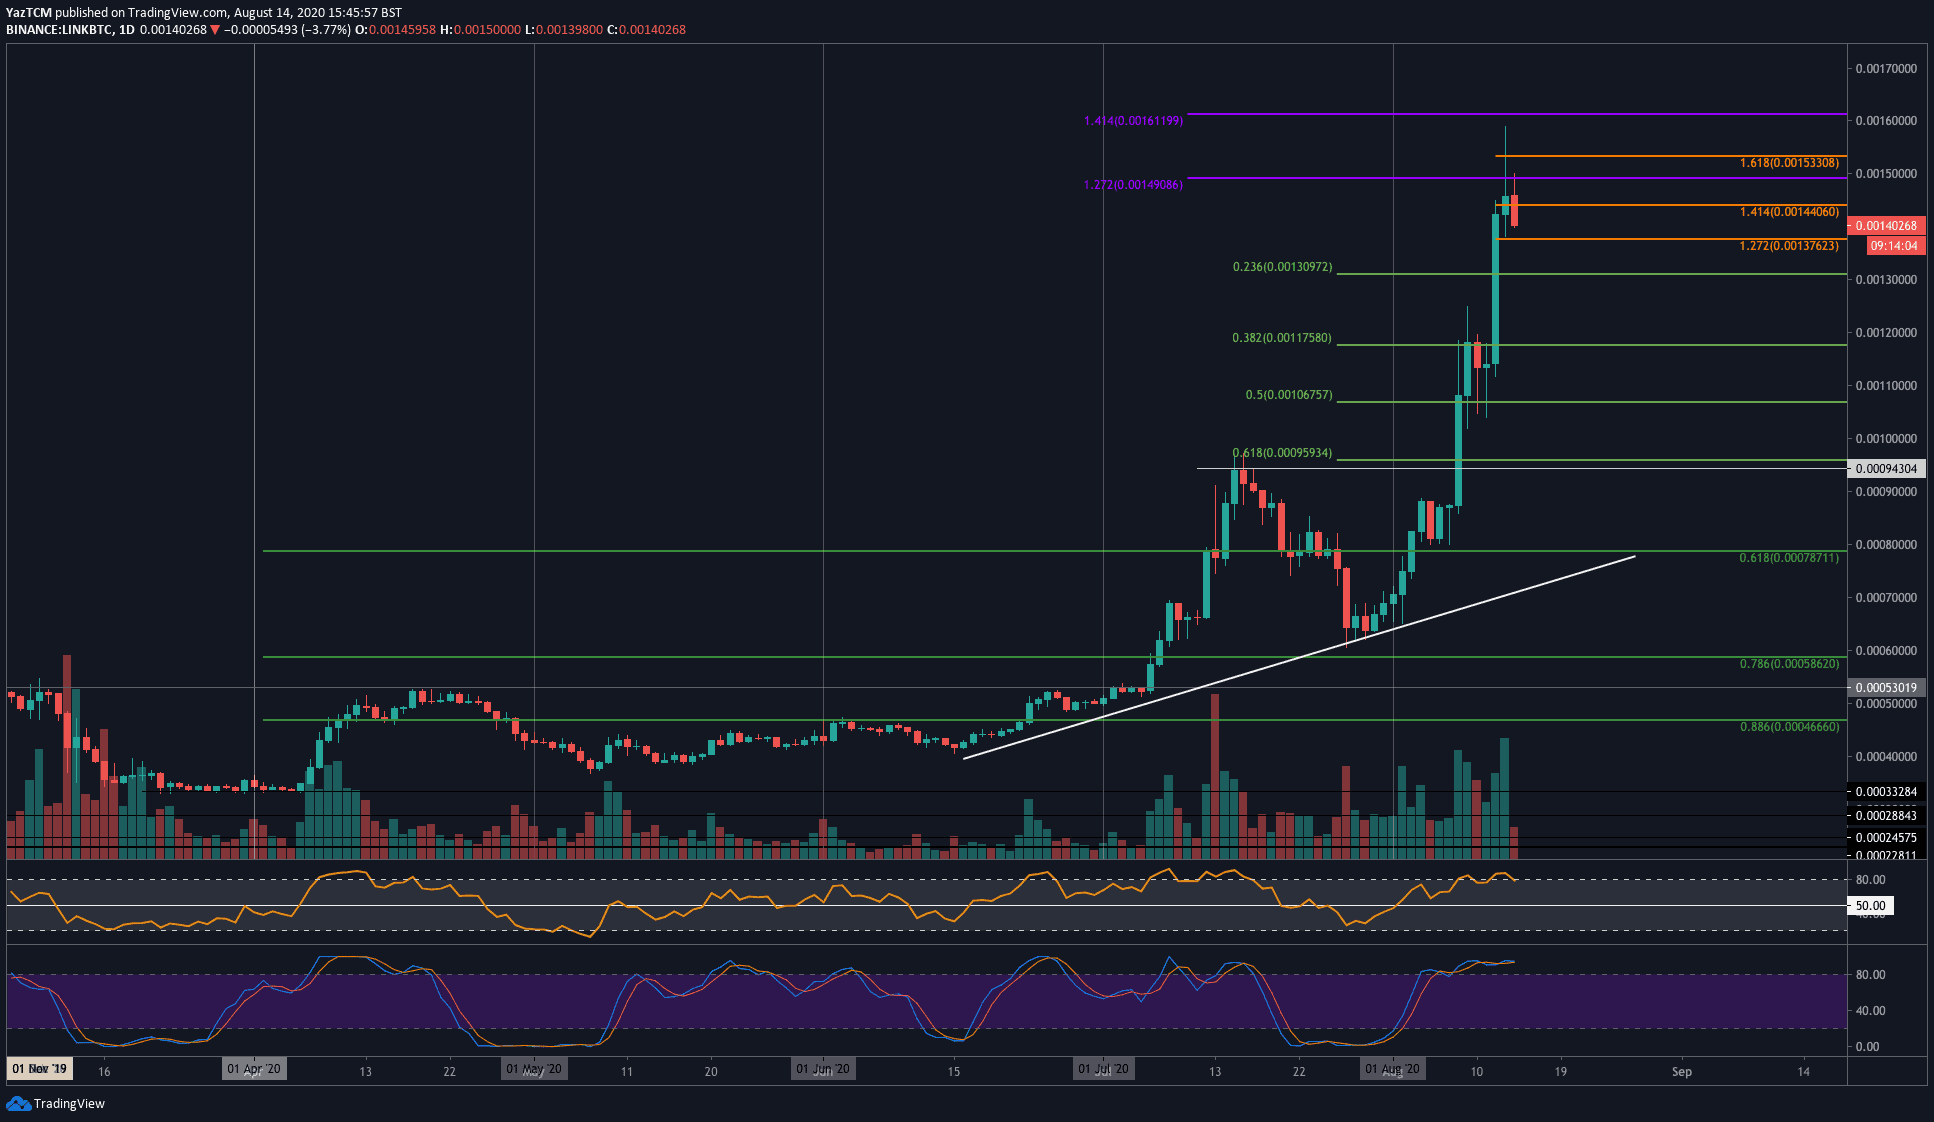
Against Bitcoin, Chainlink is in the same boat as it started the week beneath the 0.0009 BTC level and went on to surge as high as 0.00159 BTC yesterday. The coin has since dropped slightly as it trades at 0.0014 BTC.
Looking ahead, if the sellers drive LINK lower, the first level of strong support is expected at 0.0013 BTC (.236 Fib Retracement). This is followed by support at 0.00117 BTC (.382 Fib Retracement) and 0.001 BTC.
On the other side, if the buyers regroup and push higher, resistance lies at 0.00145 BTC (All-time high-day closing price), 0.0015 BTC (1.272 Fib Extension – purple), and 0.00153 BTC (1.618 Fib Extension – purple). This is followed by additional resistance at 0.00161 BTC and 0.0017 BTC.
WAVES
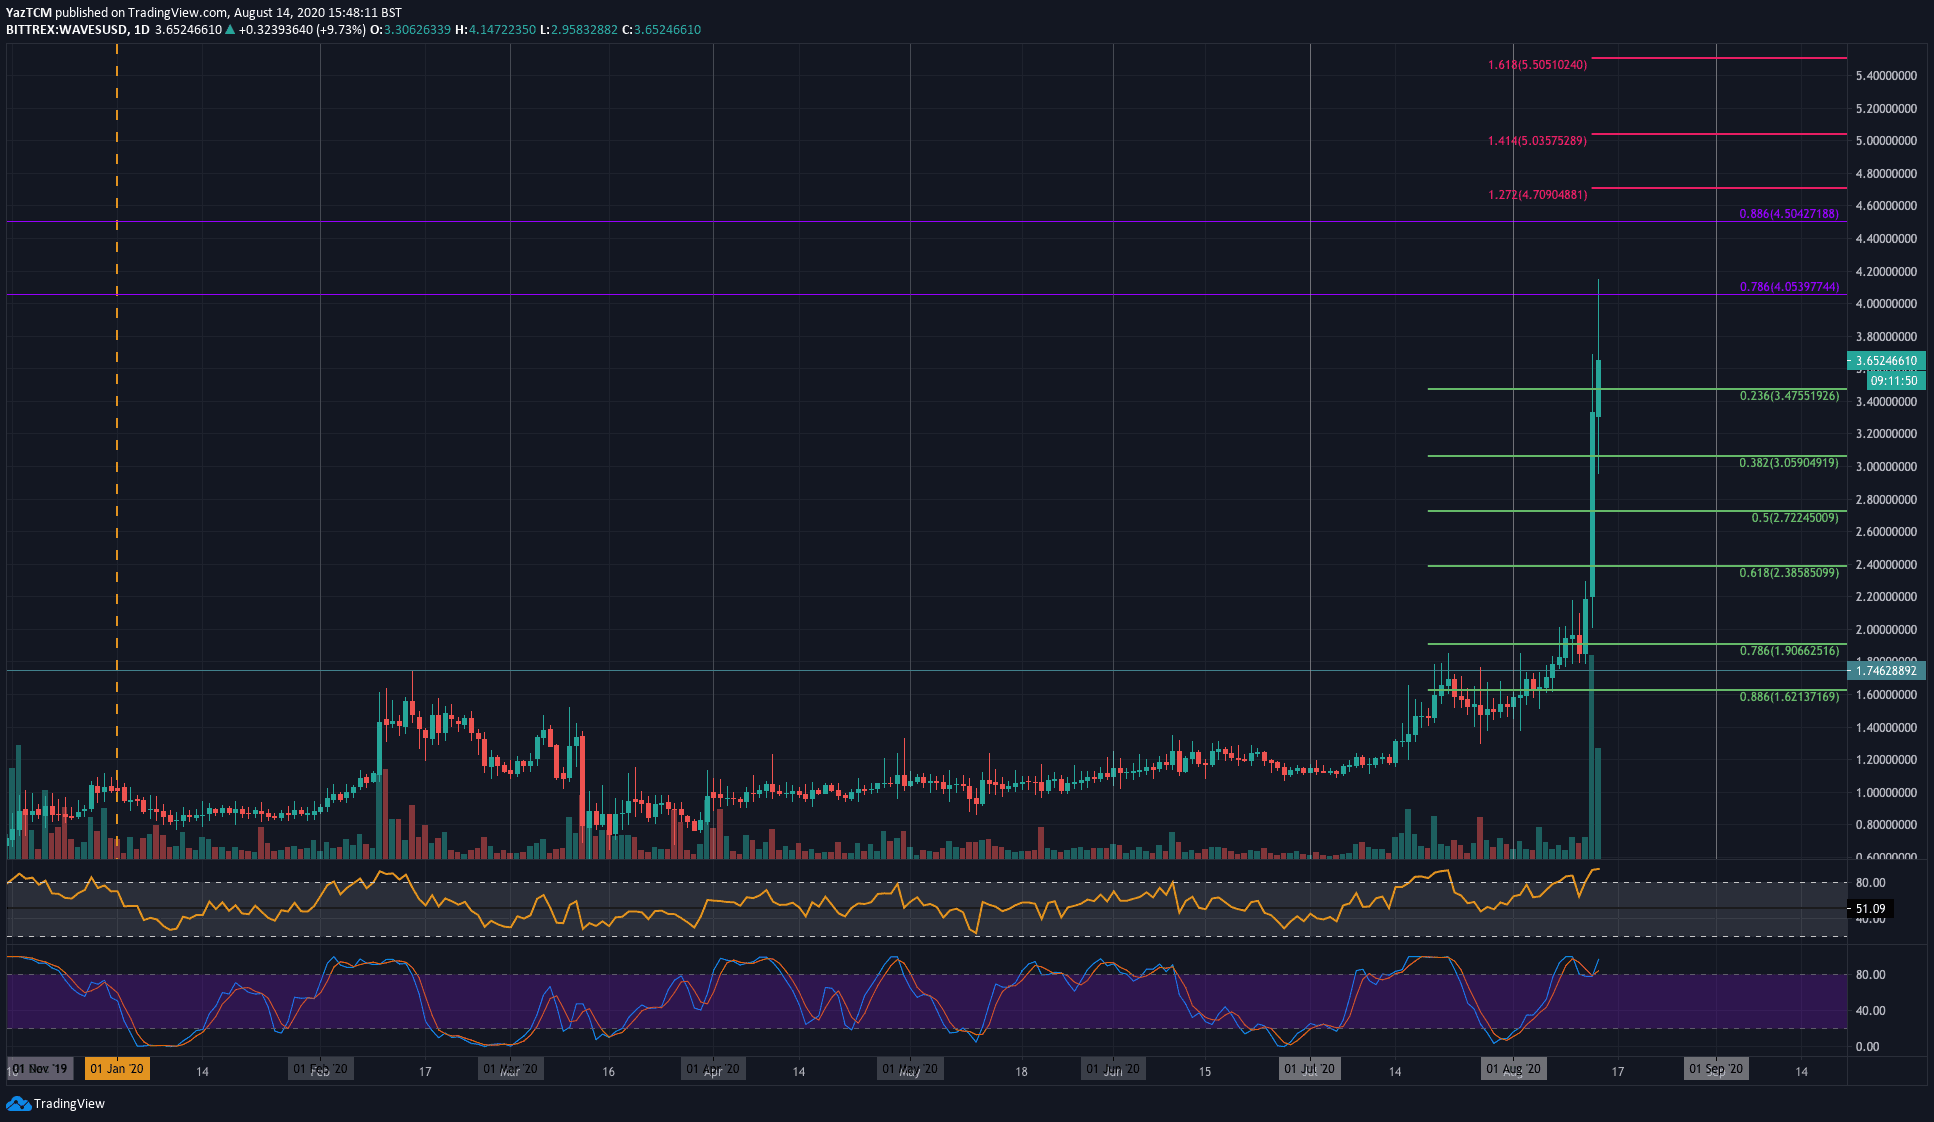
WAVES saw the largest price increase amongst the top 50 ranked coins this week as it surged by over 100%. The coin started the week by trading at around the $1.80 level. From there, it slowly started to push higher but struggled with the $2.00 level during the week.
On Wednesday, WAVES rebounded from $1.80 and pushed above $2.00 to reach $2.20. This bullish push continued yesterday as WAVES surged to the $3.50 level. The buyers continued to drive WAVES even higher today as it reached as high as $4.10. This created a fresh 20-month high for WAVES – a price not seen since December 2018.
WAVES has since dropped slightly as it trades around $3.65.
Looking ahead, if the bulls push WAVES higher again, the first level of resistance lies at $4.00 (bearish .786 Fib Retracement). This is followed by resistance at $4.50 (bearish .886 Fib Retracement), $4.70 (1.272 Fib Extension), and $5.00.
On the other side, the first level of strong support is expected at $3.50 (.236 Fib Retracement). Beneath this, support lies at $3.00 (.382 Fib Retracement), and $2.272 (.5 Fib Retracement).
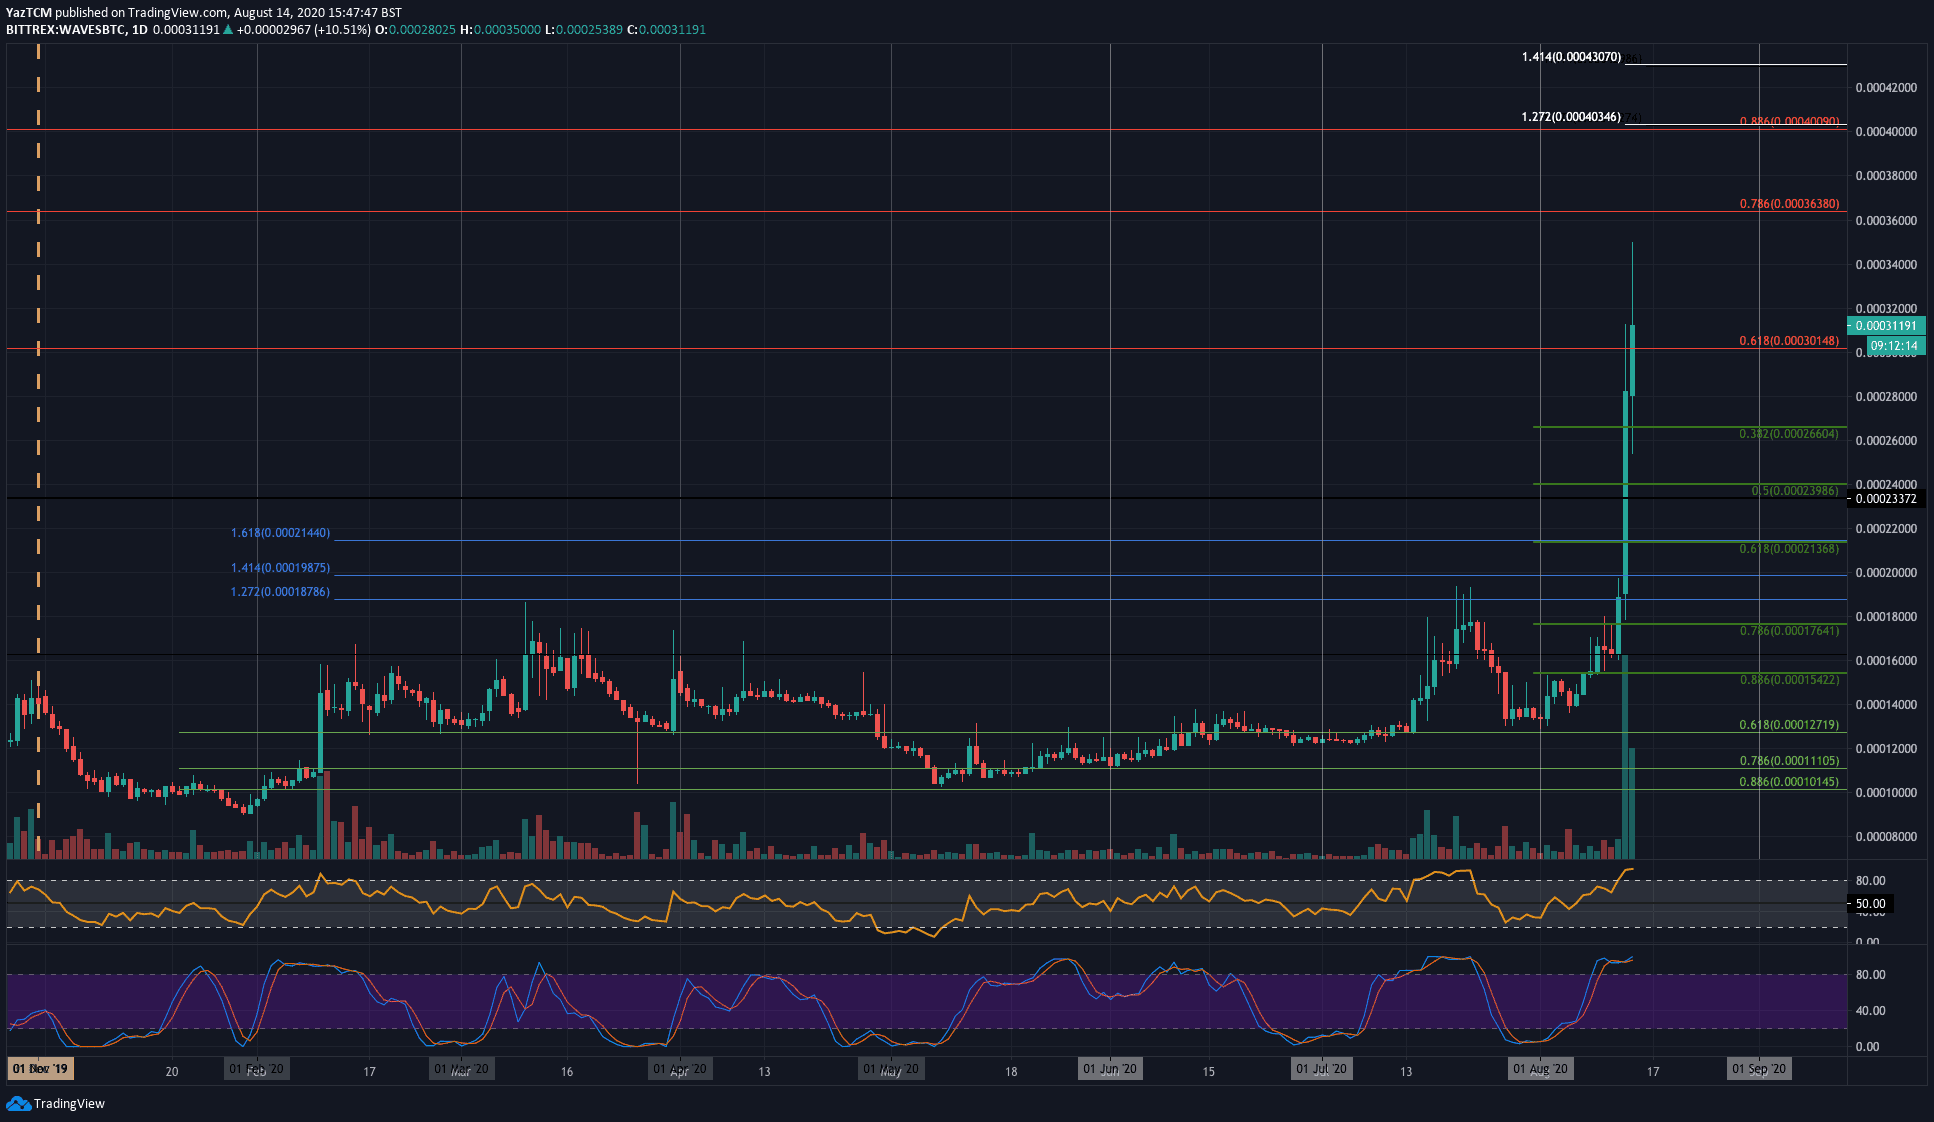
Waves also surged much higher against Bitcoin to create a fresh 15-month high for the coin at 35,000 SAT. WAVES started the week by trading beneath 15,000 SAT. From there, it pushed higher and quickly broke above the 2020 resistance at 19,000 SAT.
WAVES then continued to pump as it broke above the resistance at 30,000 SAT (bearish .618 Fib Retracement) to set the fresh 15-month high price at 35,000 SAT. WAVES has since dropped back into the 30,000 SAT level.
Looking ahead, if the bulls can regroup from 30,000 SAT and push higher, the first level of resistance lies at the 35,000 SAT level. This is then followed by resistance at 36,400 SAT (bearish .786 Fib Retracement), 40,000 SAT (bearish .886 Fib Retracement), and 43,000 SAT (1.414 Fib Extension).
On the other side, if the sellers push beneath 30,000 SAT, support is located at 28,000 SAT, 26,600 SAT (.382 Fib Retracement), and 24,000 SAT (.5 Fib Retracement).
Click here to start trading on BitMEX and receive 10% discount on fees for 6 months.
Disclaimer: Information found on CryptoPotato is those of writers quoted. It does not represent the opinions of CryptoPotato on whether to buy, sell, or hold any investments. You are advised to conduct your own research before making any investment decisions. Use provided information at your own risk. See Disclaimer for more information.
Cryptocurrency charts by TradingView.


