
A long-expected growth of volatility finally came and a lot of cryptoassets left their respective sideways channels.
Dmitriy Gurkovskiy, a senior analyst at foreign exchange broker RoboForex, provides his vision of the possible tendencies in price changes for Bitcoin as well as for other major cryptos.
Right now, they are steadily growing and demonstrating excellent dynamics. On shorter times frames, many assets are forming different patterns in favor of further bullish tendencies. For bulls, it’s very important to break these patterns’ upside borders if they want to continue their rally towards new highs. Most likely, the market activity will go on and the current correction will be just a short pause before another aggressive growth of the assets.
Bitcoin
As we can see in the daily chart, Bitcoin has been able to break a very significant resistance area, which indicates a strong bullish pressure and the unwillingness of the asset to correct. At the moment, an important support area is at $10,240 and a decline towards this level may later force another rebound to the upside and further growth. In this case, the upside target may be at $13,865. Another signal in favor of this idea will be a rebound from the support line at the RSI. However, this scenario may no longer be valid if the price breaks the rising channel’s downside border and fixes below $10,150. After that, the instrument may continue trading downwards to reach $8,695.
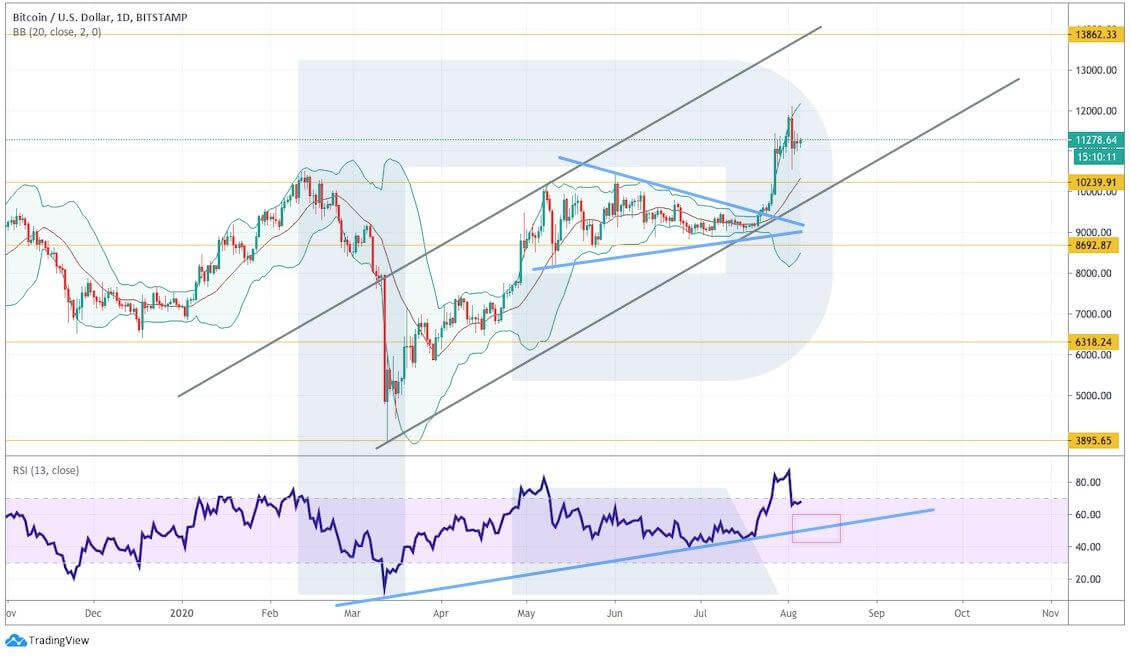
Photo: RoboForex / TradingView
In the H4 chart, BTC/USD is stuck inside a Diamond pattern, which may be both a reversal and a continuation pattern. The RSI indicator here is also very close to the support line: a rebound from the line may result in the new growth of the cryptoasset. That’s why one shouldn’t exclude the possibility of a breakout of the Diamond pattern and the active growth of the price. To confirm this idea, the asset must break the pattern’s upside border and fix above $11,565. In this case, the instrument may easily reach $13,045 in the nearest future. However, the bullish scenario may be canceled if the market breaks the pattern’s downside border and fixes below $10,775.
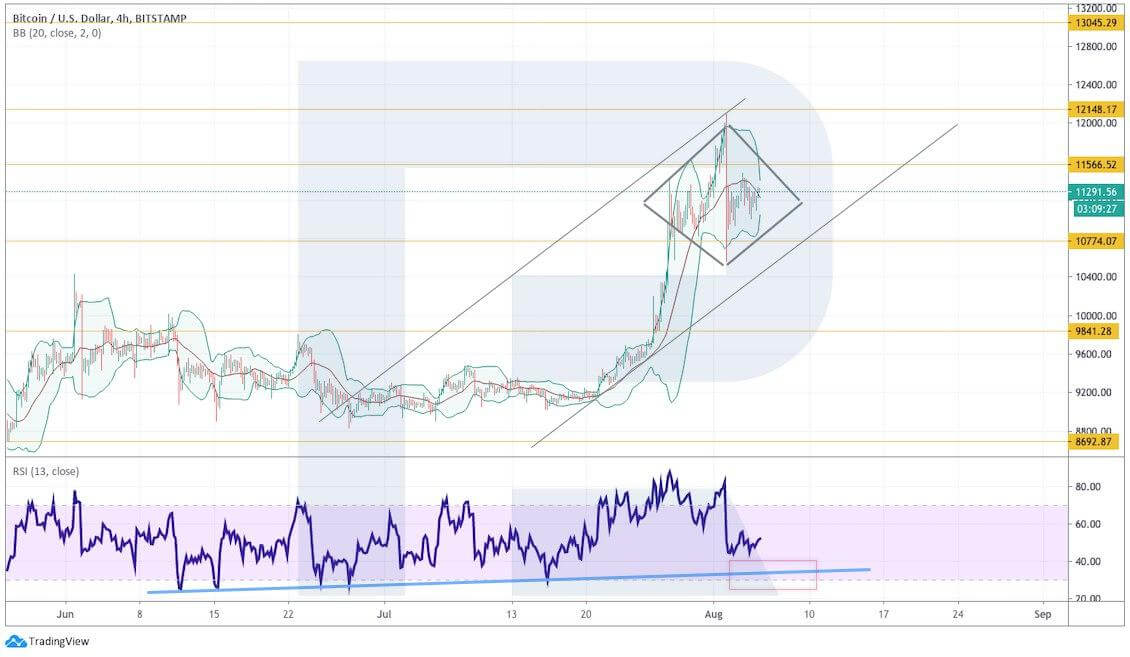
Photo: RoboForex / TradingView
Ethereum
In the daily chart, ETH/USD has also broken all the closest resistance levels, which are now providing support in case the asset returns to them. The RSI indicator has broken the descending trendline and a correction towards $355 may force the indicator to return to the line, which, in its turn, may push the price to reach new highs. After breaking $430, the instrument may continue skyrocketing towards $515. However, this scenario may no longer be valid if the market breaks the support area and fixes below $355. In this case, the asset may break the rising channel’s downside border and continue falling to reach $290.
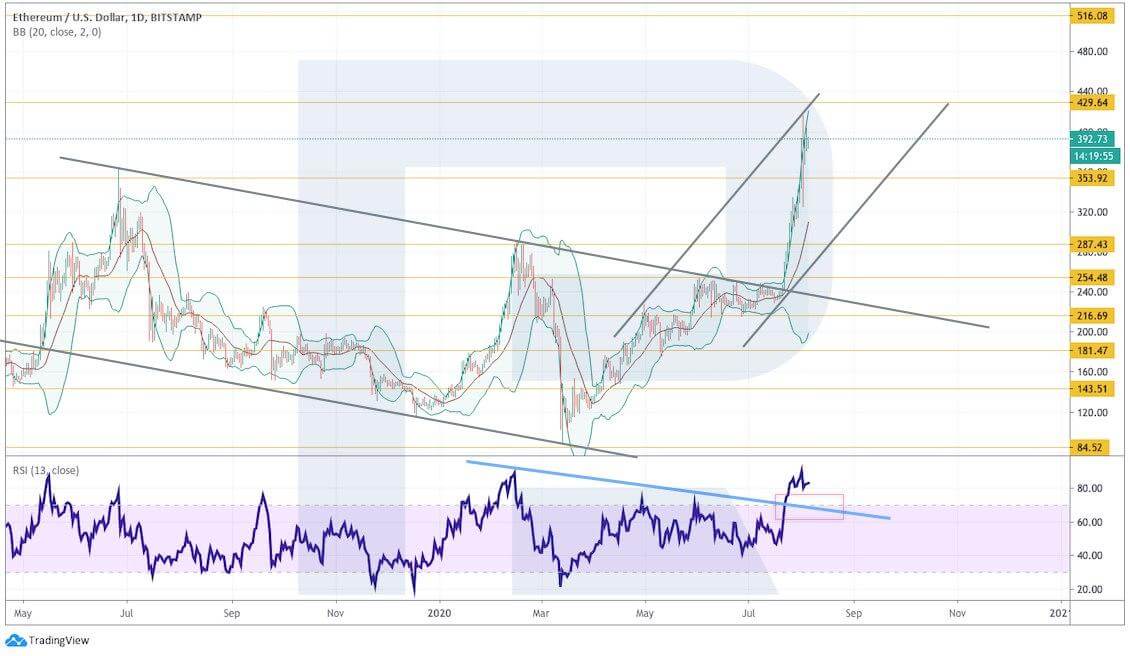
Photo: RoboForex / TradingView
On shorter timeframes, Ethereum is growing within the rising channel and forming a Triangle pattern. As a rule, such patterns are broken in the direction of the current trend. A signal in favor of further uptrend is a rebound from the trendline at the RSI. To confirm the bullish scenario, the pair must break the pattern’s upside border and fix above $405. The closest upside target will be at $420, a breakout of which may indicate further growth towards $460. Still, this scenario may be canceled if the price breaks the pattern’s downside border and fixes below $360. After that, the instrument may break the rising channel’s border and continue falling with the target at $300.
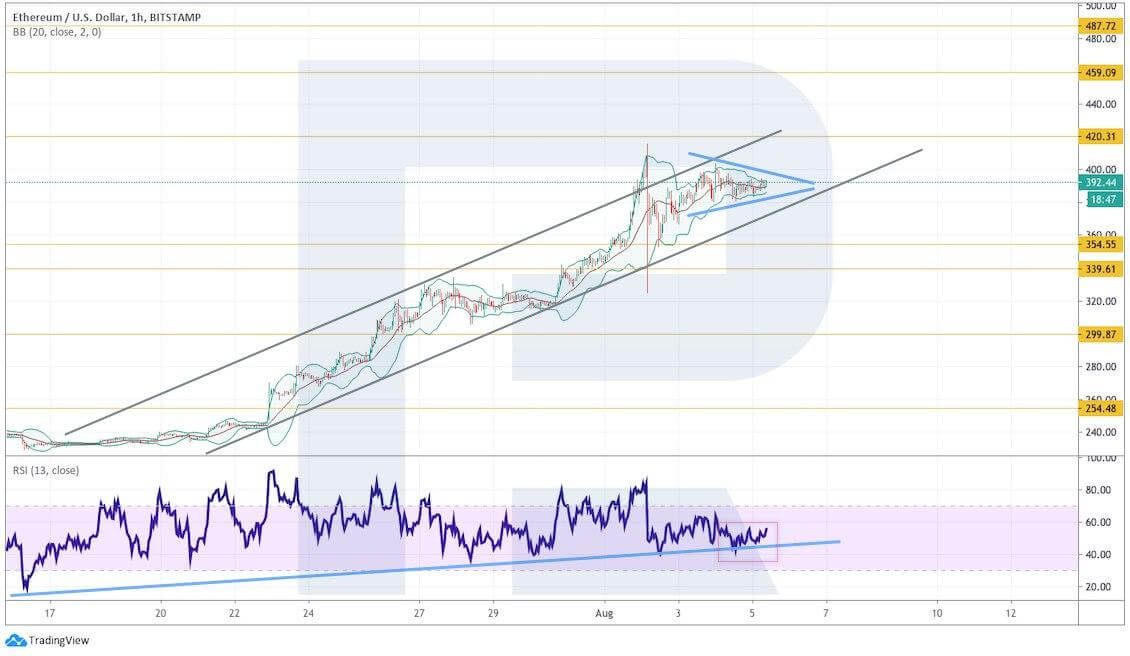
Photo: RoboForex / TradingView
Litecoin
As we can see in the daily chart, Litecoin is no longer moving within a long sideways channel. Probably, after breaking such a range to the upside, the asset may start a proper uptrend. The RSI indicator is approaching the broken trendline, a test and a rebound from which may indicate further growth. To confirm the bullish scenario, the pair must break the rising channel’s upside border and fix above $65. In this case, the instrument may cover the width of this channel and reach $85. However, this scenario may be canceled if the price breaks the rising channel’s downside border and fixes below $51. After that, the market may fall and return to $39.
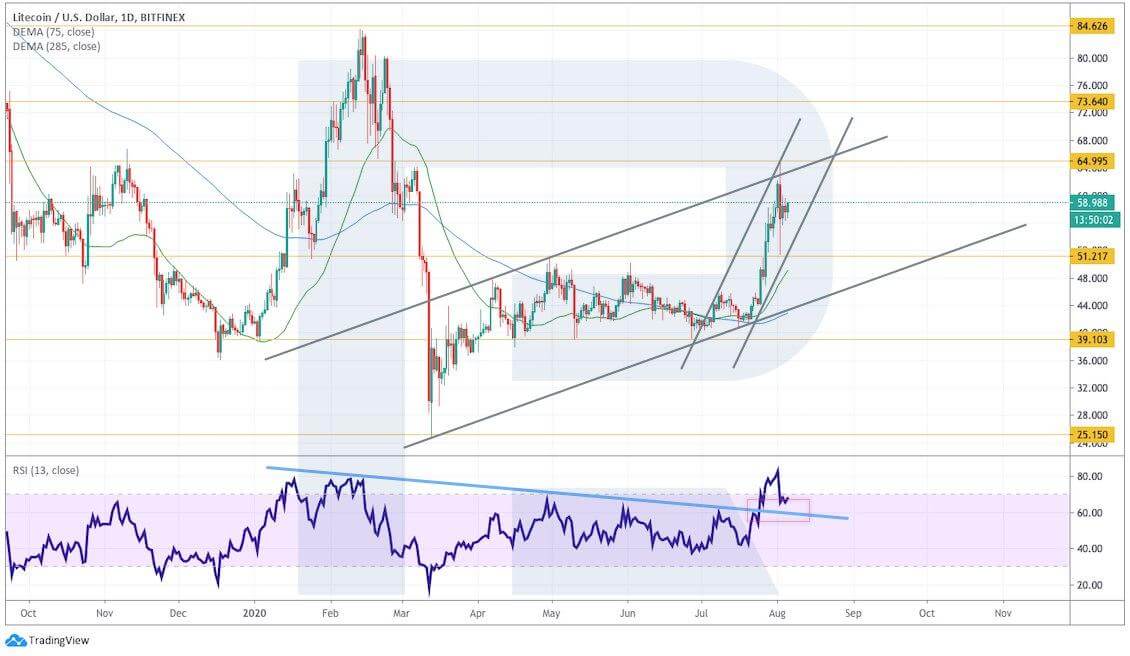
Photo: RoboForex / TradingView
In the H4 chart, there is a Diamond pattern. To confirm the bullish scenario, the price must break the pattern’s upside border and fix above $62.55. in this case, the instrument may continue trading upwards to reach $75.75. Another signal in favor of this idea will be a rebound from the support line at the RSI. However, this scenario may no longer be valid if the market breaks the pattern’’ downside border and fixes below $53.80. In this case, the asset may continue falling towards $46.25.

Photo: RoboForex / TradingView
XRP
In the daily chart, XRP has broken the rising channel’s upside border and that’s a strong signal in favor of further growth of the asset. The closest resistance is $0.3470, a breakout of which may result in a strong rising movement towards $0.4845. Another signal to confirm the bullish impulse will be a rebound from the trendline at the RSI: as we can see here, bulls have broken the indicator’s resistance line. However, this scenario may no longer be valid if the price gets back inside the rising channel. After that, the instrument may resume falling towards the support area at $0.2395.
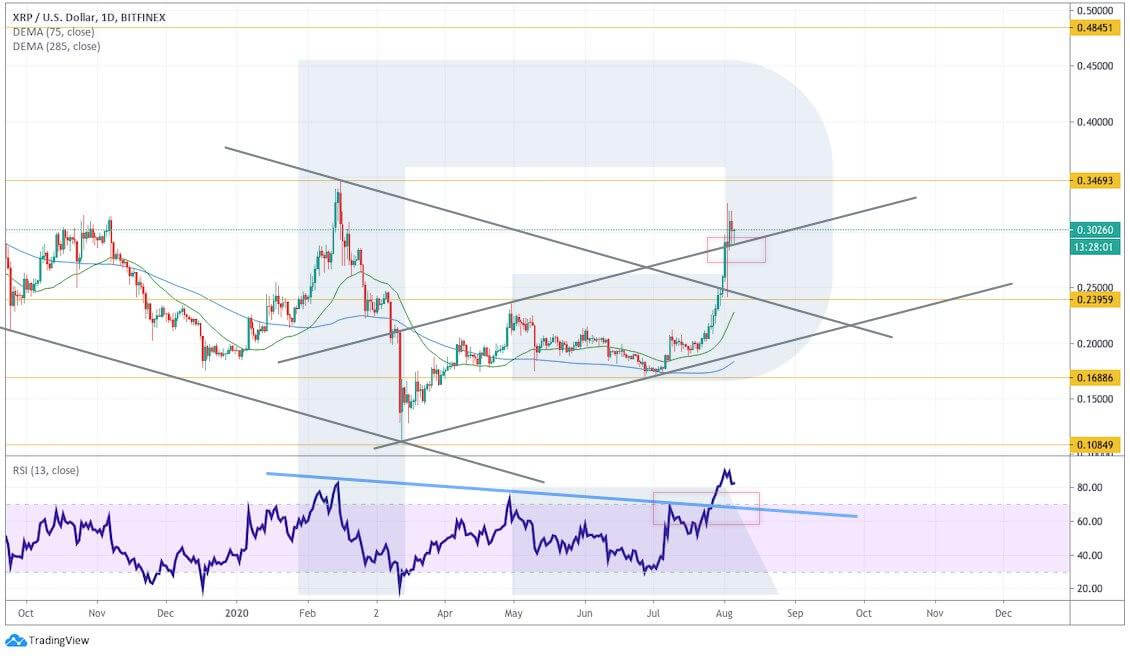
Photo: RoboForex / TradingView
On shorter timeframes, the asset is growing within the rising channel. The price is constantly rebounding from Moving Averages, thus indicating the strength of the current trend. Here, the cryptocurrency is also forming a Triangle pattern. If the price breaks the pattern’s upside border and fixes above $0.3280, it may continue trading upwards with the target at $0.3825. A signal in favor of this idea will be another rebound from the support line at the RSI. However, this scenario may be canceled if the instrument breaks the pattern’s downside border and fixes below $0.2695. In this case, the asset may continue falling to reach $0.2130.
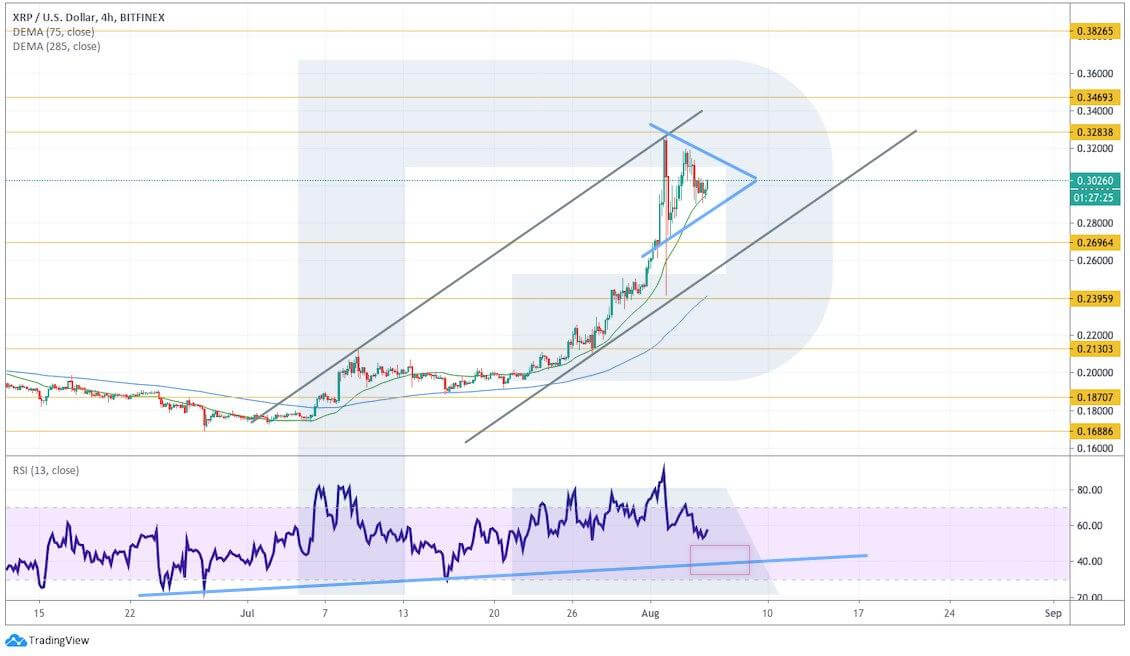
Photo: RoboForex / TradingView
Bitcoin Cash
In the daily chart, Bitcoin Cash is also no longer trading inside a long sideways range. By now, the cryptocurrency has already rebounded from the support area and there are chances of seeing a new rising wave with the target at $413 or even higher, $497. To confirm this idea, the asset must break the rising channel’s upside border and fix above $380. In this case, the pair may continue growing and cover at least the width of the channel. Another signal in favor of this scenario will be a test of the broken trendline at the RSI. However, the bullish scenario may be canceled if the market breaks the rising channel’s downside border and fixes below $260. After that, the instrument may continue trading downwards with the target at $204.
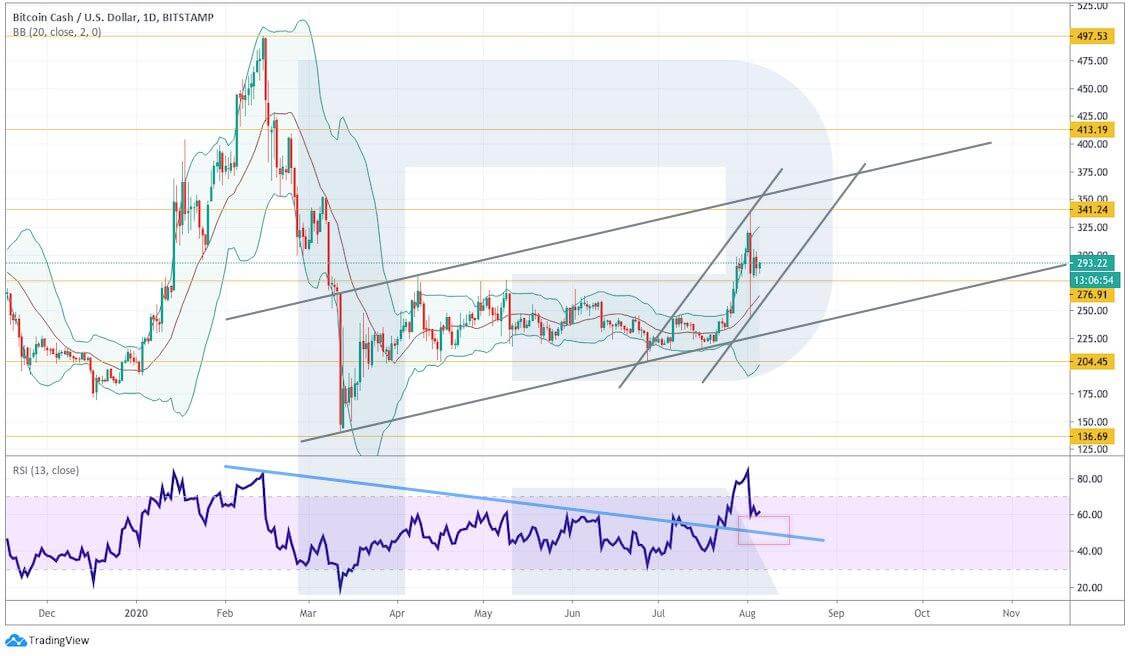
Photo: RoboForex / TradingView
As we can see in the H4 chart, the cryptocurrency is stuck within a Diamond pattern. After the price breaks the pattern’s upside border and fixes above $306, it may continue growing towards $340 or even higher, $370. Another signal in favor of this idea is a rebound from the support line at the RSI. However, if the market breaks the rising channel’s downside border and fixes below $274, the instrument may continue falling to reach $247.
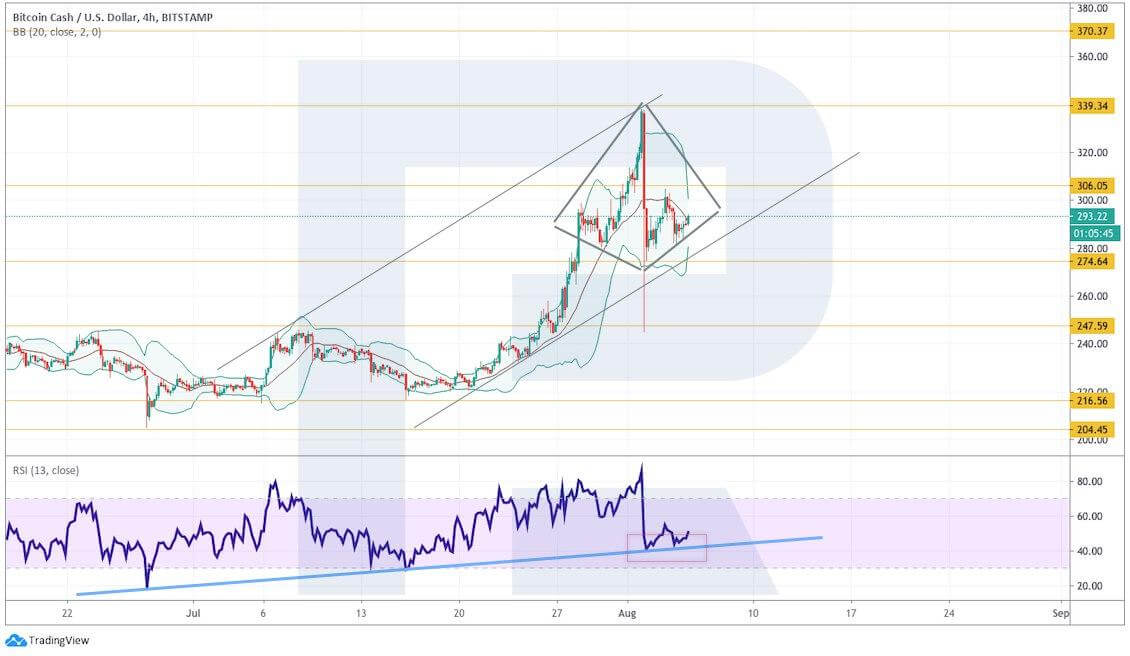
Photo: RoboForex / TradingView
Disclaimer: Any predictions contained herein are based on the author’s particular opinion. This analysis shall not be treated as trading advice. RoboForex shall not be held liable for the results of the trades arising from relying upon trading recommendations and reviews contained herein.

Dmitriy Gurkovskiy is a senior analyst at RoboForex, an award-winning European online foreign exchange forex broker.


