
This article series shows every month a dashboard with aggregate industry metrics in consumer staples (most popular ETFs in this sector: XLP, VDC, FTSA, IYK).
Shortcut
If you are used to this dashboard series or if you are short of time, you can skip the first paragraphs and go to the charts. However, reading everything once is necessary if you want to use the metrics for stock picking purposes.
Base Metrics
We calculate the median value of five fundamental ratios for each industry: Earnings Yield (“EY”), Sales Yield (“SY”), Free Cash Flow Yield (“FY”), Return on Equity (“ROE”), Gross Margin (“GM”). Our calculation universe includes large companies in the U.S. stock market. The five base metrics are calculated on trailing 12 months. For all of them, higher is better. EY, SY and FY are medians of the inverse of Price/Earnings, Price/Sales and Price/Free Cash Flow. They are better for statistical studies than price-to-something ratios, which are unusable or non available when “something” is close to zero or negative (for example, companies with negative earnings). We also calculate two momentum metrics for each group: the median monthly return (RetM) and the median annual return (RetY).
We use medians rather than averages because a median splits a set in a good half and a bad half. A capital-weighted average is skewed by extreme values and the largest companies. Our metrics are designed with a stock-picking mindset, not for index investing.
Value and Quality Scores
We calculate historical baselines for all metrics. They are noted respectively EYh, SYh, FYh, ROEh, GMh, and they are calculated as the averages on a look-back period of 11 years. For example, the value of EYh for Food in the table below is the 11-year average of the median Earnings Yield in food companies.
We define the Value Score (“VS”) as the average difference in % between the three valuation ratios (EY, SY, FY) and their baselines (EYh, SYh, FYh). The same way, the Quality Score (“QS”) is the average difference between the two quality ratios (ROE, GM) and their baselines (ROEh, GMh). The formulas are below.
VS = 100*((EY-EYh)/EYh+(SY-SYh)/SYh+(FY-FYh)/FYh)/3
QS = 100*((ROE-ROEh)/ROEh+(GM-GMh)/GMh)/2
The scores are in percentage points (hence the factor 100). VS may be interpreted as the percentage of undervaluation or overvaluation relative to the baseline. A positive score points to undervaluation, a negative one to overvaluation (positive is good, negative is bad). This interpretation must be taken with caution: the baseline is an arbitrary reference, not a supposed fair value. The formula assumes that the three valuation metrics are of equal importance.
Current data
The next table shows the metrics and scores as of last week’s closing. Columns stand for all the data named and defined above.
|
VS |
QS |
EY |
SY |
FY |
ROE |
GM |
EYh |
SYh |
FYh |
ROEh |
GMh |
RetM |
RetY |
|
|
Staple/Food Retail |
-5.09 |
-29.76 |
0.0391 |
2.2732 |
0.0356 |
8.90 |
20.43 |
0.0510 |
2.1436 |
0.0349 |
16.63 |
23.49 |
9.15% |
15.54% |
|
Food |
-19.62 |
-0.68 |
0.0412 |
0.6031 |
0.0220 |
14.40 |
35.82 |
0.0496 |
0.7813 |
0.0272 |
15.51 |
33.85 |
3.45% |
0.39% |
|
Beverage |
-21.58 |
2.85 |
0.0266 |
0.2706 |
0.0189 |
23.64 |
55.01 |
0.0392 |
0.3188 |
0.0229 |
23.07 |
53.28 |
4.35% |
-0.14% |
|
Household prod. |
-19.69 |
7.35 |
0.0184 |
0.7735 |
0.0529 |
15.42 |
44.15 |
0.0395 |
1.0107 |
0.0449 |
14.75 |
40.09 |
4.68% |
-4.60% |
|
Personal care |
-18.10 |
-7.15 |
0.0306 |
0.4307 |
0.0203 |
14.94 |
58.81 |
0.0411 |
0.5142 |
0.0232 |
20.03 |
52.92 |
3.90% |
10.06% |
|
Tobacco |
85.14 |
-54.01 |
0.0654 |
1.0196 |
0.0282 |
5.55 |
34.61 |
0.0629 |
0.4379 |
0.0129 |
19.84 |
54.06 |
4.36% |
-8.38% |
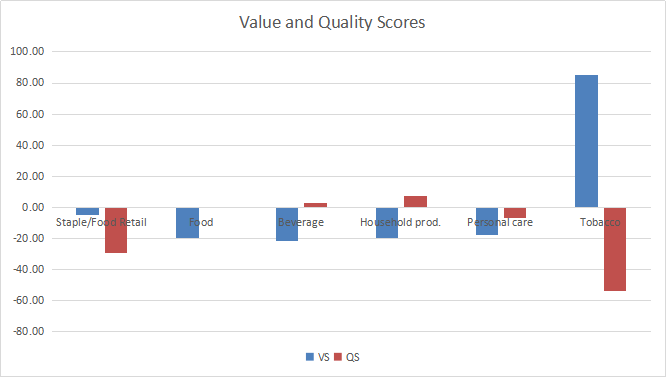
Value And Quality chart
The next chart plots the Value and Quality Scores by industries (higher is better).
Momentum
The next chart plots momentum data.
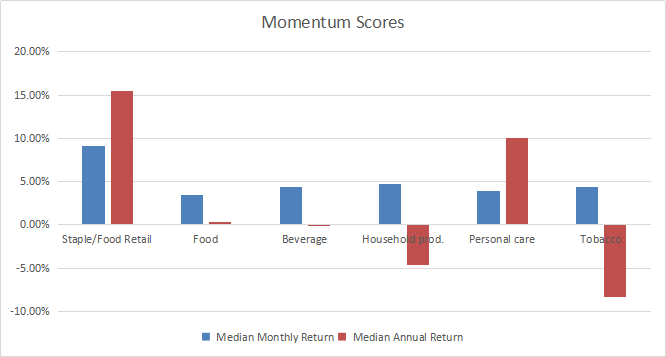
The best-performing S&P 500 stocks in the sector in 1 month are: Church & Dwight Co. (CHD), Costco Wholesale Corp. (COST), Fortune Brands Home & Security Inc. (FBHS), McCormick & Co. (MKC), Walmart Inc. (WMT).
Dashboard List
The list below was published for Quantitative Risk & Value subscribers several weeks ago based on data available at this time. These stocks were in the good half among their peers for 3 valuation ratios and ranked on higher return on equity. This is not investment advice. Do your own research before buying.
|
Pilgrim’s Pride Corp. |
|
|
Seneca Foods Corp. |
|
|
J. M. Smucker Co. |
|
|
Tyson Foods Inc. |
|
|
Kroger Co. |
|
|
Nu Skin Enterprises Inc. |
|
|
Herman Miller Inc. |
|
|
Schweitzer-Mauduit Intl Inc. |
Interpretation
Staple and food retail is close to the historical baseline in valuation, but the quality score is bad. The tobacco industry looks very good in valuation and very bad in quality, but in our market cap universe this is a small set (5 companies): statistics must be taken with caution. Other groups look overvalued by about 20%, with quality scores showing less than 10% deviation from the baseline.
We use the table above to calculate Value and Quality Scores. It may also be used in a stock-picking process to check how companies stand among their peers. For example, the EY column tells us that a food company with an Earnings Yield above 0.0412 (or TTM price/earnings below 24.27) is in the better half of the industry regarding this metric. A Dashboard List is sent every month to Quantitative Risk & Value subscribers with the most profitable companies standing in the better half among their peers regarding the three valuation metrics at the same time.
Our cheap stock lists are designed to outperform their sector benchmarks on the long-term. Quantitative Risk & Value (QRV) provides you with a realistic quantitative approach of market risk and sector-oriented value. Get started with a two-week free trial and see how QRV can improve your investing decisions.
Disclosure: I am/we are long TSN,SJM,KR. I wrote this article myself, and it expresses my own opinions. I am not receiving compensation for it (other than from Seeking Alpha). I have no business relationship with any company whose stock is mentioned in this article.


