
Average analyst S&P 500 forecasts and S&P history Factoids:
- 2020 operating earnings: -21.1% and revenue: -3.7%
- 2021 operating earnings: +28.0% and revenue: +8.4%
- Net effect (2021 vs 2019): 2-year earnings about 1% higher and revenue about 4% higher.
- Standard & Poor’s forecasts 12.51% forward 5-year operating earnings growth rate
- S&P 500 published history is 5.06% 20-year and 9.09% 30-year operating earnings growth
- Current forward P/E is 22.3 versus 5-yr avg 16.9, 10-yr avg 15.2 and 20-yr avg 15.4
Overall forecasts seem optimistic compared to history and visible potential 1 to 2-year earnings problems.
Goldman Sachs (June 12, 2020):
“It is one thing to want exposure to an economic recovery. It is another thing to have to pay the same price for this expansion … as you were having to pay for exposure to a steadily growing U.S. economy with no pandemic in sight – as was the case on January 1st”
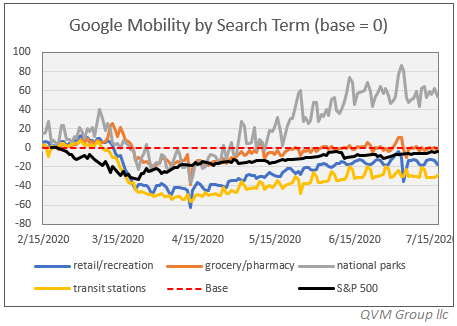
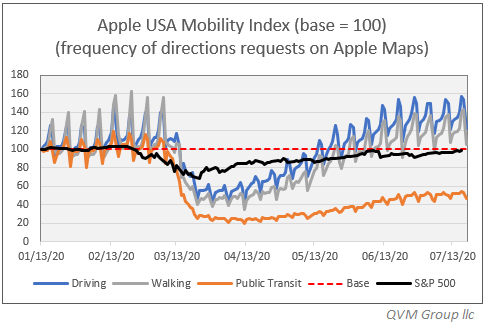
The direction of change in daily mobility data from Apple and Google seem to correlate well with the direction of change in the S&P 500 (in black below).
The direction of change in mobility seems to be flattening (perhaps due to the rise in COVID in the South and West) which may suggest a flattening force acting on the S&P 500.
Certainly, if COVID gets much worse in Q4 as pandemic history and many scientists and doctors suggest, there will be either mandated lock-downs or significant self-imposed lock-downs and renewed supply chain disruptions (read that stock up on sanitizer, toilet paper, etc.) that would further slow the economy, lower corporate profits and dampen or depress the stock market. A Q4 COVID spike could make the negative 24.4% Q3 and negative 12.4% Q4 earnings forecasts look ambitious.
|
~ Thinking About Venturing Forth |
~ Venturing Forth |
|
|
|
Add to that the growing prospect of a Democrat sweep in November and the promised increases in corporate taxes and investment income taxes, the 28% 2021 earnings growth forecast will not occur.
Suggestion:
Underweight equities, tilt toward large-cap quality, overweight cash and high quality debt, (maybe hold non-energy high yield debt if you believe in the Fed Put), and overweight Europe and China (who have better COVID control) as deviations from but not abandonment of long-term strategic plan.
Also tilt tactical sleeve toward those securities that focus on the activities that continue or accelerate during a lock-down, particularly internet, online and streaming services.
You need to be patient, to hold strategic positions and to hold cash for clear signs of recovery, not jumping with FOMO (Fear Of Missing Out). Warren Buffett said this about biding your time:
“The stock market is a device to transfer money from the impatient to the patient”
Don’t chase crowds because you fear missing out . There will be time, and as Goldman Sachs pointed out prices seem irrational. Warren Buffett expressed it well with:
“In the short-run, the stock market is a voting machine. Yet, in the long-run, it is a weighing machine.”
Don’t “vote” – “weigh”.
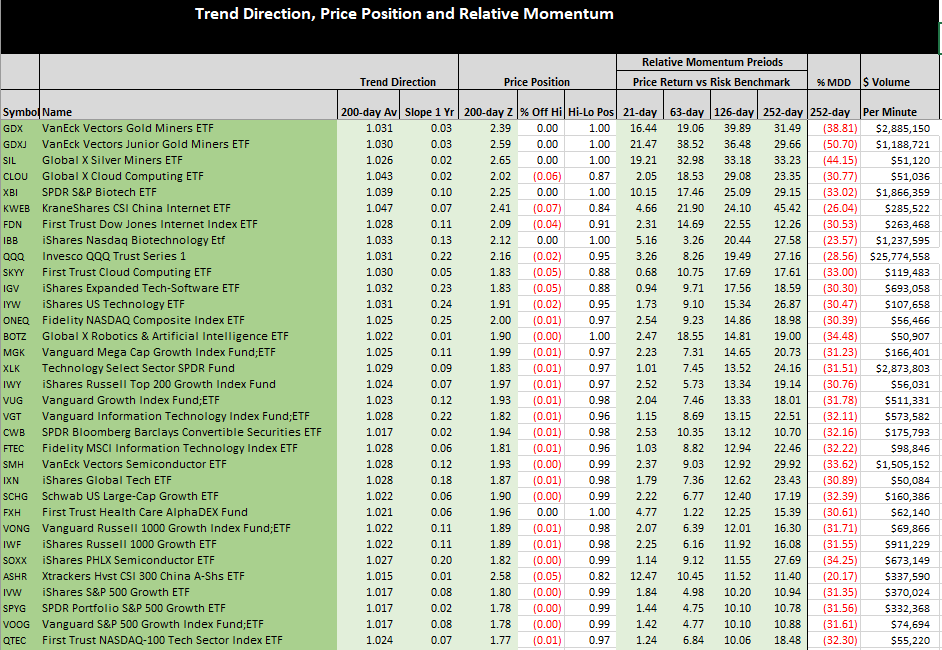
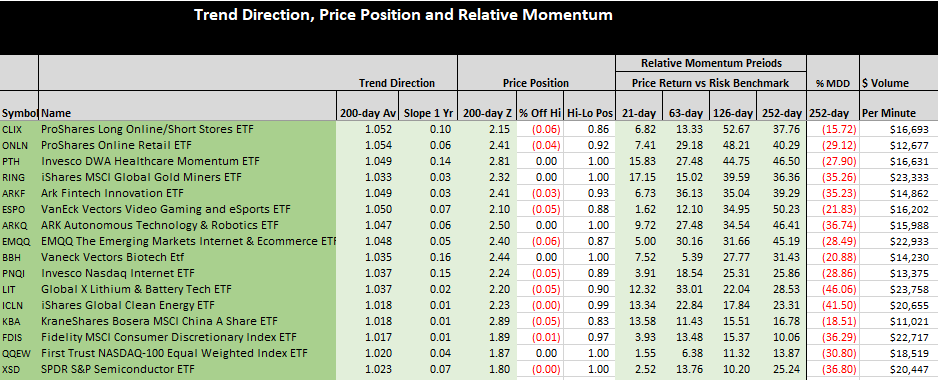
Screens for ETFs that have been outperforming the S&P 500
All ETFs in these lists have outperformed the S&P 500 on a price return basis over 252 market days (1-yr), 126 days (6 months), 63 days (3 months) and 21 days (1 month). The 1-month leading edge of their 200-day moving average trend line is moving up, and the 1-year slope of the linear regression trend line is up; and the price is above the 200-day trend line.
The “200-day Z” is the number of standard deviations the price is above the trend line, which could indicate an overbought condition and the risk of a reversion back toward the trend line, particularly if Z > 2.
The “$ Volume Per Minute” indicates the level of trading liquidity which should be considered relative to the size of a trade. Sometimes more interesting ideas are not as liquid as the most popular ideas.
The “% MDD 252-day” is the percentage decline from highest high to lowest low over the past year (the “maximum drawdown”). The MDD for the S&P 500 (SPY) was 34.10. In these times, it may be preferable to select ETFs that had a lower MDD than the S&P 500.
These ETFs had average $/minute trading volume of $50,000 or more and outperformed the S&P 500 by at least 10% over the past 126 market days (6 months).
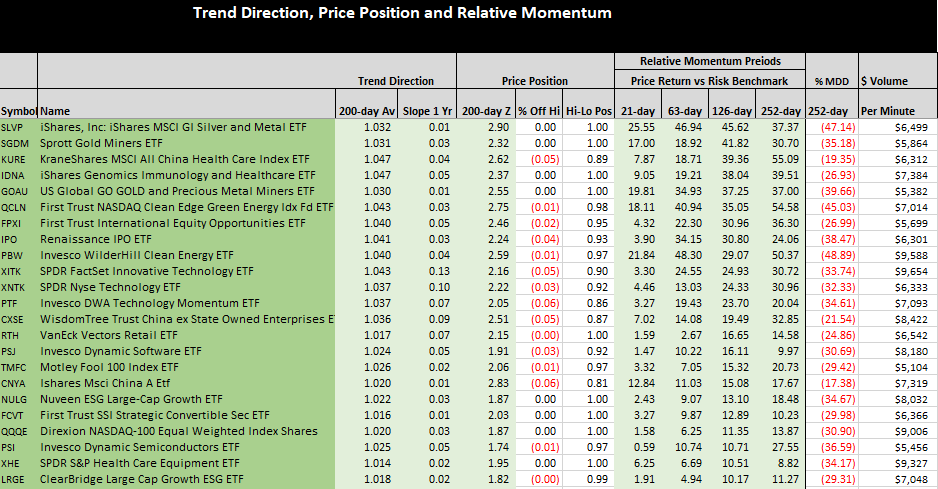
These ETFs outperformed >= 10% over 126 days with average $ volume per minute from $25,000 to $49,999.
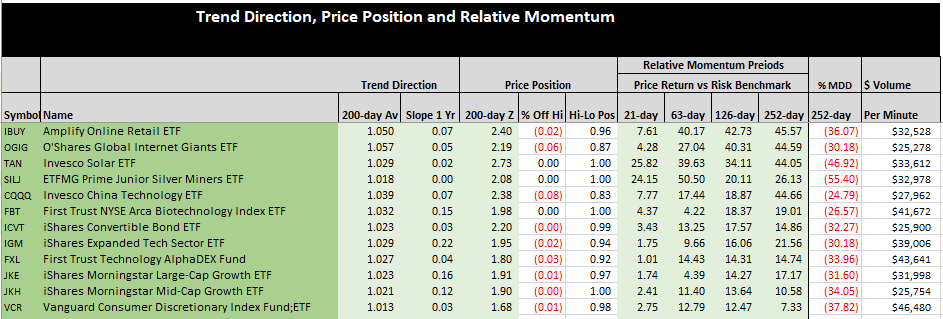
These ETFs outperformed >= 10% over 126 days with average $ volume per minute from $10,000 to $24,999.
In a low liquidity category, these ETFs outperformed >= 10% over 126 days with average $ volume per minute from $5,000 to $9,999.
It is possible that volume will “appear” once you place an order to accommodate otherwise low trading volume securities, but the Bid/Ask spread will be larger than for liquid securities (not always a problem). You should really want to be in such a security and without a short-term perspective to invest in low $ volume securities, or to take small positions – they may be easier to buy than to sell.
Always check trading volume. There are some ETFs out there that barely trade. Wait for them to grow up.
SPECIAL FILTER:
ETFs or mutual funds that outperformed the S&P 500 over 1-year, generally higher performance in the last few years (if they existed that long) and had a price decline less than 30% from March 1 to March 23 (the COVID crash). Maybe relative strength during COVID crash portends relatively more strength in Q4 if the worst comes true.
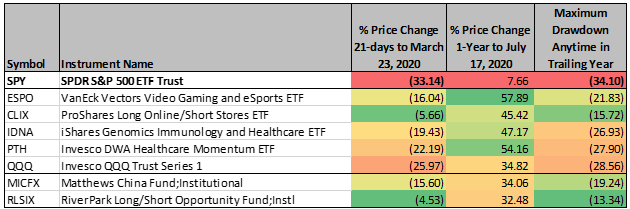 You will note that other than the info tech heavy NASDAQ 100 (QQQ) each fund has an attribute that makes it potentially attractive for the next pandemic downdraft.
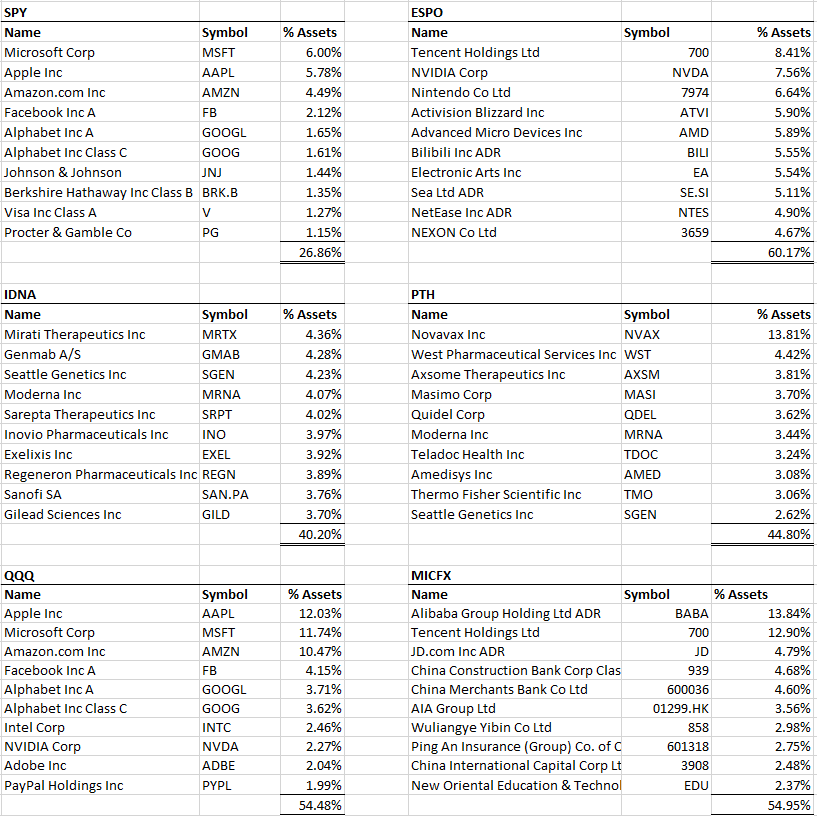
- ESPO is online gaming pure and simple. That’s what millions do when they cannot go outside.
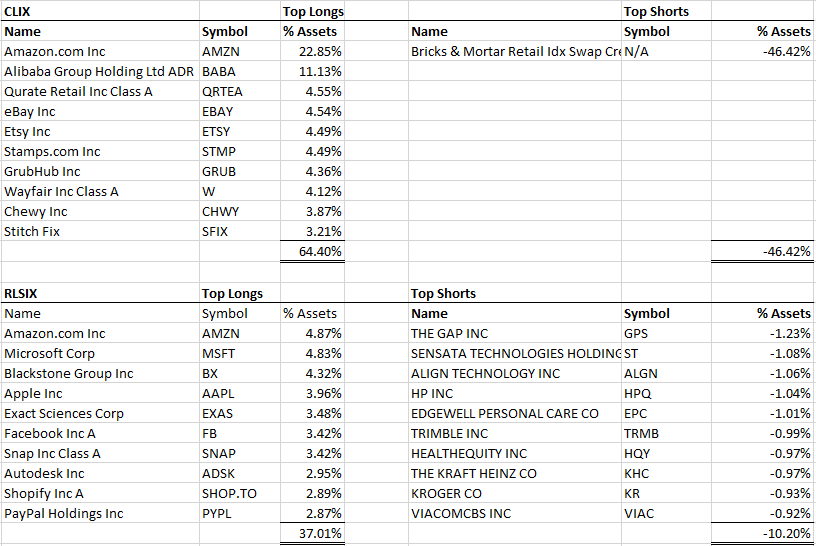
- CLIX holds long positions in online shopping stocks and is short in-store stocks (via a swap)
- IDNA holds stocks engaged in finding therapies and solutions to the pandemic
- PTH holds a different slice but the same variety of stocks as IDNA
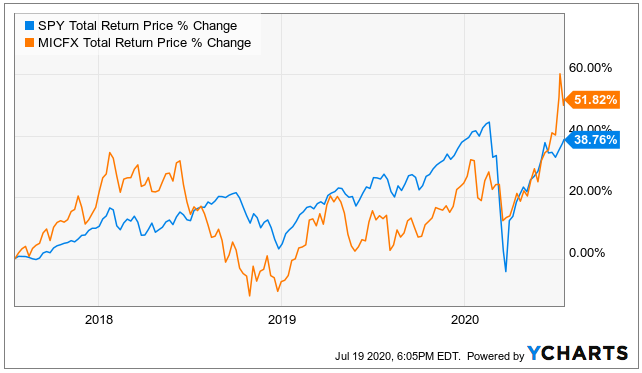
- MICFX is active and holds Chinese stocks – China is growing and has reasonable COVID control
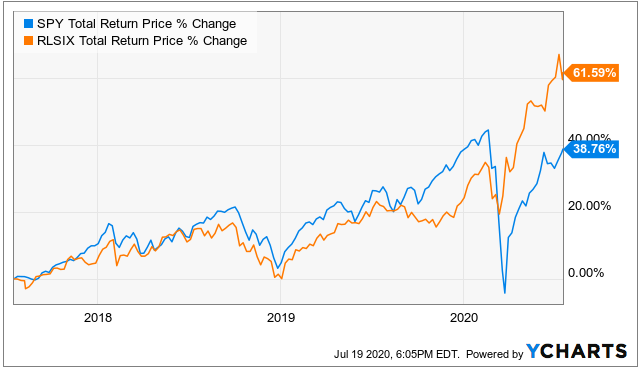
- RLSIX is active with a long sleeve and short sleeve that has worked out well.
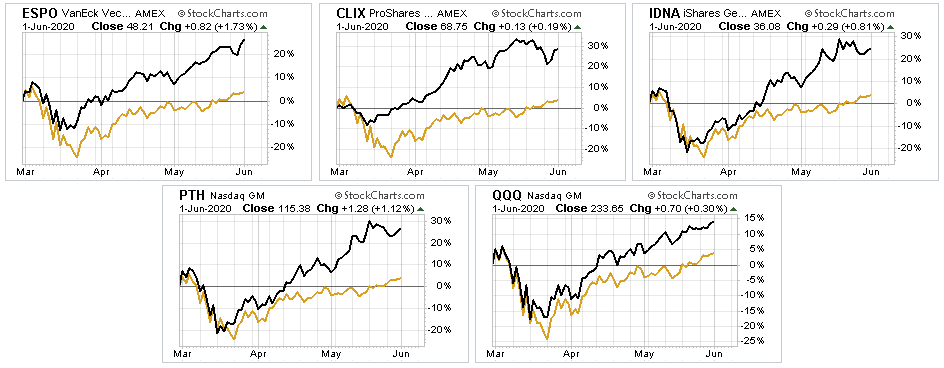
March 1 2020 to June 1 2020
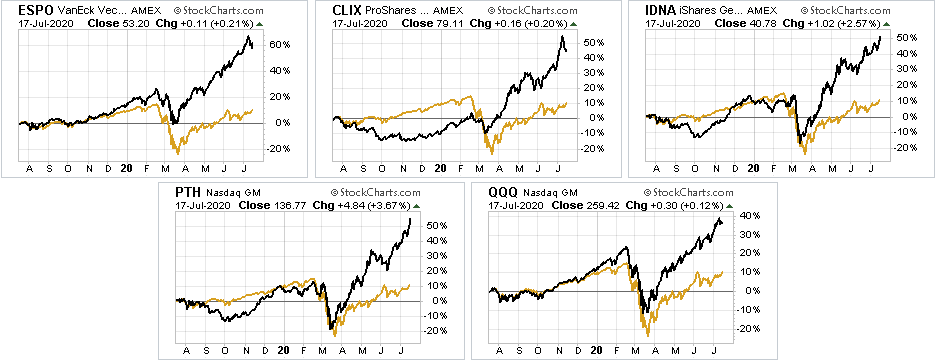
Here is how the ETFs did in the short-term once the US market cracked due to COVID. Subject ETF in black and S&P 500 (SPY) in gold.
1 Year
This is how they did relative to the S&P 500 over the trailing year.
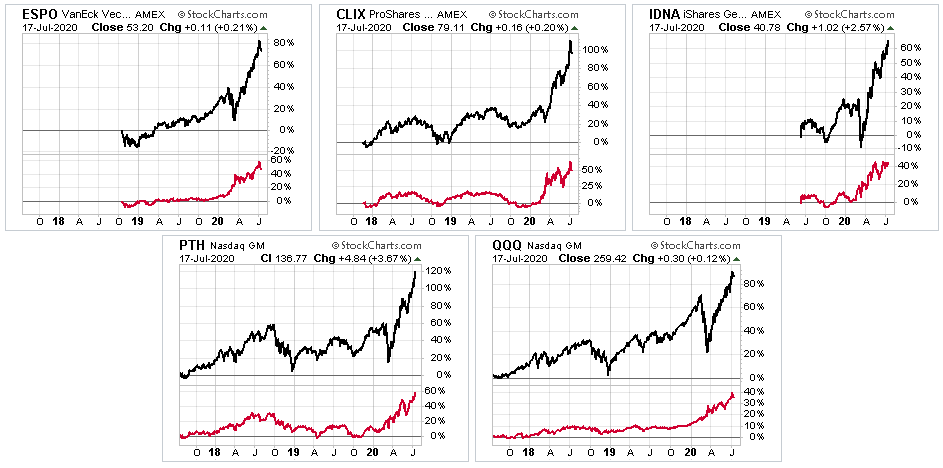
3 Years
This is how they did relative to the S&P 500 over the past 3 years, to the extent that they were in existence during that time (ETF in black and S&P 500 in red in lower panel).
3-Years
This is how the two active mutual funds did relative to the S&P 500 over the past 3 years (the fund in orange and the S&P 500 in blue).
|
RLSIX |
MICFX |
|
|
|
The funds have a higher expense ratio than the ETF (also longer operating histories). This is how their approach is described, along with some attributes of the fund with Morningstar ratings.
MICFX: Matthews China
The investment seeks long-term capital appreciation. Under normal circumstances, the fund seeks to achieve its investment objective by investing at least 80% of its net assets, which include borrowings for investment purposes, in the common and preferred stocks of companies located in China. China includes its administrative and other districts, such as Hong Kong. A company or other issuer is considered to be “located” in a country or a region, and a security or instrument is deemed to be an Asian (or specific country) security or instrument, if it has substantial ties to that country or region.
Min Inv:$1,00 0 Assets:$1.1 B Holdings: 41 Net Exp: 0.91% Inception: 10/2010
Morningstar Rating : 3-Yr Stars: 4 Risk: Above Average Return: Above Average Sharpe Ratio: 0.59
RLSIX: RiverPark Long/Short Opportunity
The investment seeks long-term capital appreciation while managing downside volatility. The fund seeks long-term capital appreciation while managing downside volatility by investing long in equity securities that RiverPark believes have above-average growth prospects and selling short equity securities the Adviser believes are competitively disadvantaged over the long term. It invests primarily in the securities of U.S. companies, but it may also invest outside the U.S. The fund limits its investments in the securities of foreign issuers to no more than 15% of its assets.
Min Inv:$1,000 Assets:$253.7 M Holdings: 339 Net Exp: 1.80% Inception: 03/2012
Morningstar Ratings: 3-Yr Stars: 5 Risk: Above Average Return: High Sharpe Ratio: 1.25
These tables present the top 10 positions for each ETF and mutual fund along with the top 10 for the S&P 500 (as represented by SPY).
CLIX and RLSIX top 10’s are listed on the next page with two columns, one for their top 10 longs and the other for their top 10 shorts.


