
- Gold looks likely to finish the week 0.22% higher.
- Last week was a much stronger close as the precious metal pushed 1.57% higher.
Fundamental backdrop
Despite some positive data this week there still seems to be lots of reasons for investors/traders to look for some safety. The COVID-19 pandemic is showing no signs of slowing down in the US as a record number of cases is being printed almost every day. Despite this, there has been heavy rotation into the stock markets especially the tech sector. The tech sector is a great sector to go for during a lockdown as the public reliance on apps like Zoom and Facebook grows.
Bond yields are being suppressed by the massive amounts of stimulus being added by central banks. Corporate bonds are also fair game (for central banks) it seems as the likes of the BoJ and Fed are hovering them up. If any of the companies start to default then there could be big trouble ahead.
The last time this much money was pumped into the economy was the 2008 financial crisis. Well, now the levels have far surpassed 2008. It was then gold made a massive run at breaking the all-time highs and the bull run didn’t end till the market printed its new and current all-time high in 2011. This led me to look at the differences in the price action between now and then to look for clues.
Technical picture
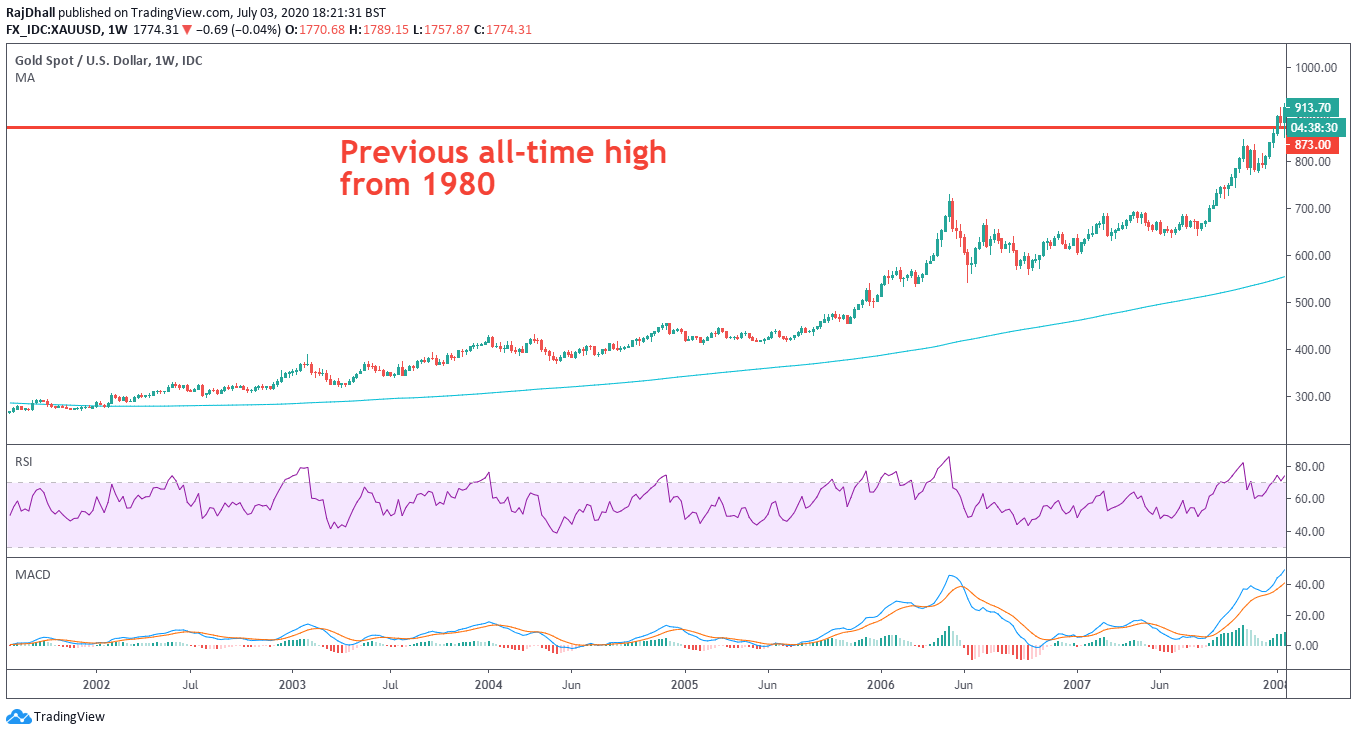
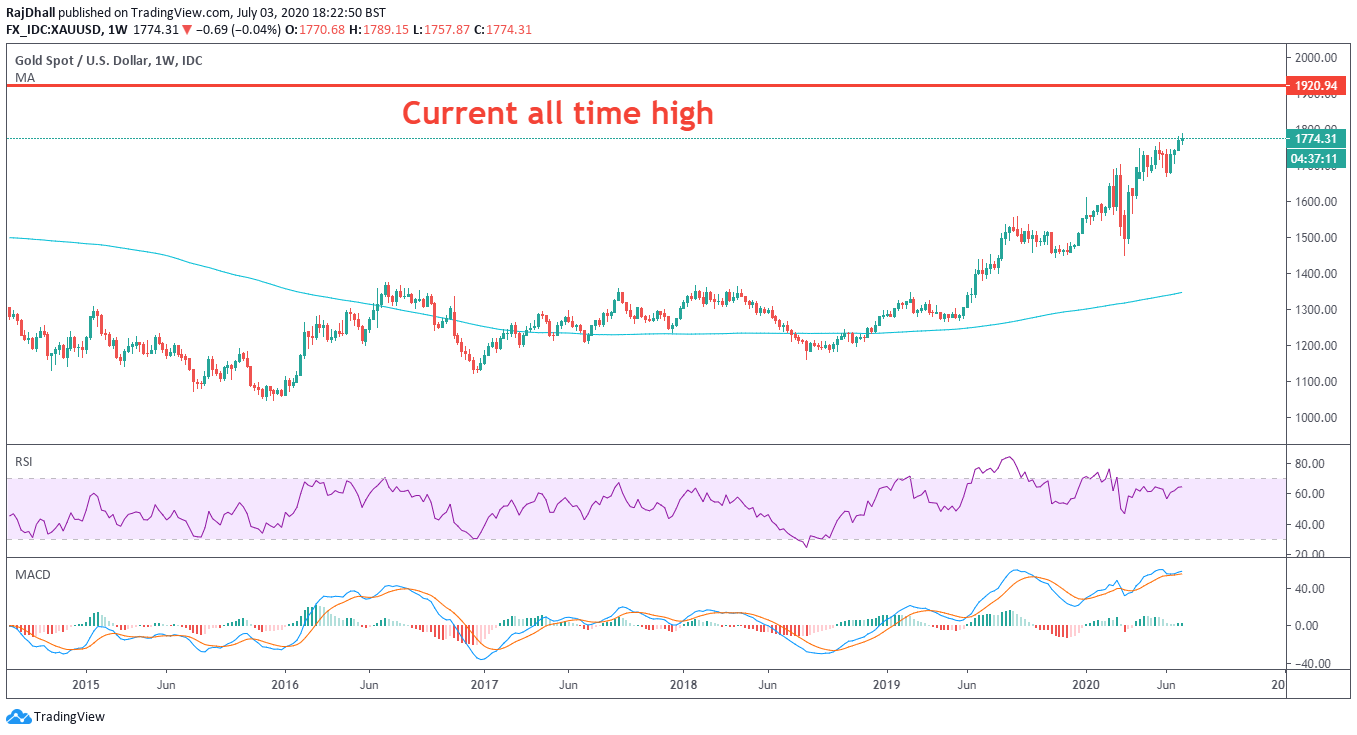
It has taken 3,223 days (nearly 9 years) for gold to get to this level since reaching its all-time high back on 6th September 2011 of USD 1,920.94 per troy ounce. This led me to think about the last time gold broke out of its all-time highs after such a long retracement period.
In January 1980 gold traded as high as USD 873.00 per troy ounce but it took until early 2008 (28 years!) for the precious metal to break that high. What did the price action look like and what were the technical signals.
I have roughly plotted a 5-year graph of the price action leading up to the break of the high and also 5 years prior to the current price of USD 1774.31 per troy ounce.
From the low to the high on the chart below is an increase of about 70%. In the chart above the increase is around 216%. Obviously the value makes a big difference in the change in percentage terms.
From a technical perspective, the price hit the oversold area in the Relative Strength Index many more times. The acceleration of the move is also very different, this time out the Relative Strength Index is making a divergence pattern but in the chart above the velocity of the move was much smoother and the price spent more time above the 50 area on the indicator.
Looking at the MACD in the time period between 2002 and 2008 the indicator’s signal lines spent nearly the whole time above the zero level. On the chart below, between 2015 and today’s date the indicator has been much choppier. Confirming this theory is the prices distance away from the 200 Simple Moving Average. the price spent the pretty much the whole time above the moving average on the chart above and on the chart below gold has only been above the moving average since 2019.
This could tell us that there is more time to wait until the price of gold reaches the all-time high. The trend in the chart above was clearly smoother and more mature. At the moment the price action is more erratic and the good news is it may not be too late to enter this trend and catch a decent chunk of this bull market.
The pullbacks on the chart above were also not as dramatic as the ones at the moment. This could mean that there may be another opportunity if you are holding an upward bias. Any dip toward the 50 level on the Relative Strength Index indicator presented a real buying opportunity and maybe this time out it may do the same.
There are some obvious similarities between the two trends but the current trend seems like it is much earlier in the bull phase. Therefore if the price is to reach and break the current all-time high we could have to wait and be patient.
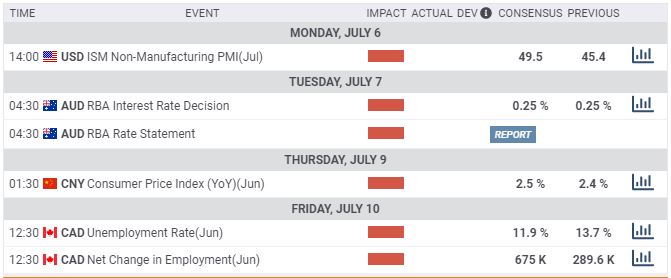
Main events next week
Next week there is not too much tier 1 data. The main event will surely be more about the COVID-19 pandemic and the US reaction to potentially more lockdowns. The ISM non-manufacturing data will give us a good indication of how the economy is fairing.
The RBA may be a non-event but if there is mention of how strong the Australian dollar has become it could get interesting. They are not likely to move on rates but they could try and mention the fact that the stong AUD could harm the countries economic recovery following the coronavirus pandemic.
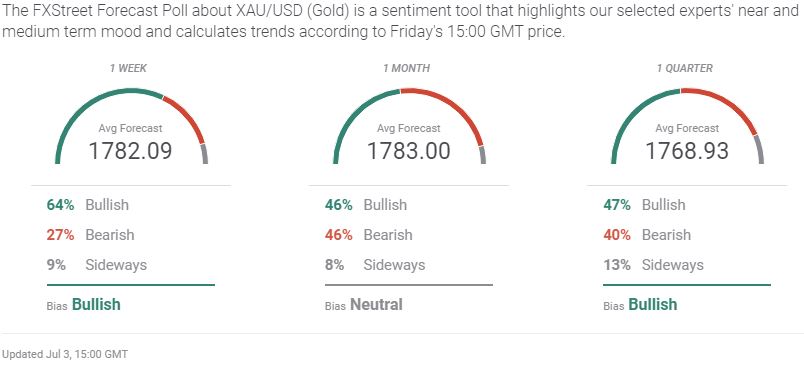
Latest gold poll result
The latest results from the FXStreet poll shows that trades are still bullish in the short term but are slightly mixed over the longer-term horizons. Interestingly this is contrary to my views as the price is looking overextended at the moment but after a decent pull back the bulls could gather enough momentum for another big push higher toward the USD 1800 per troy ounce resistance zone.
Links to other gold articles
Gold Price Analysis: Consolidates around $1775 level, bullish bias remains
Gold Price Analysis: There is a bearish signal on the 4-hour chart
Gold: Momentum indicators retain their positive configuration (video)


