- GBP/USD carries the upside breaks of four-day-old falling trend line.
- Bullish MACD keeps the buyers hopeful beyond the previous resistance line.
- Key Fibonacci retracements add to the upside barriers.
GBP/USD consolidates the previous day’s run-up around 1.2620 amid the initial Asian session on Tuesday. The pair managed to cross a descending trend line from June 10 while extending its bounce off 1.2455 on Monday. However, the bulls are likely catching a breather near 50% Fibonacci retracement level of June 10-15 fall.
Not only the 50% Fibonacci retracement level of 1.2635 but 200-HMA, currently around 1.2640, also challenges the pair buyers. Additionally, Friday’s high near 1.2655 and 61.8% of Fibonacci retracement close to 1.2680 will also play their roles in probing the quote’s further upside.
In a case where the GBP/USD prices rise beyond 1.2680, 1.2720 and the monthly top near 1.2815 could return to the charts.
Meanwhile, the pair’s fall below an immediate ascending trend line around 1.2605 could trigger fresh declines towards 1.2550. Should the sellers sneak in under 1.2550, Monday’s bottom adjacent to 1.2455 and the monthly low near 1.2325 may gain the market’s attention.
GBP/USD hourly chart
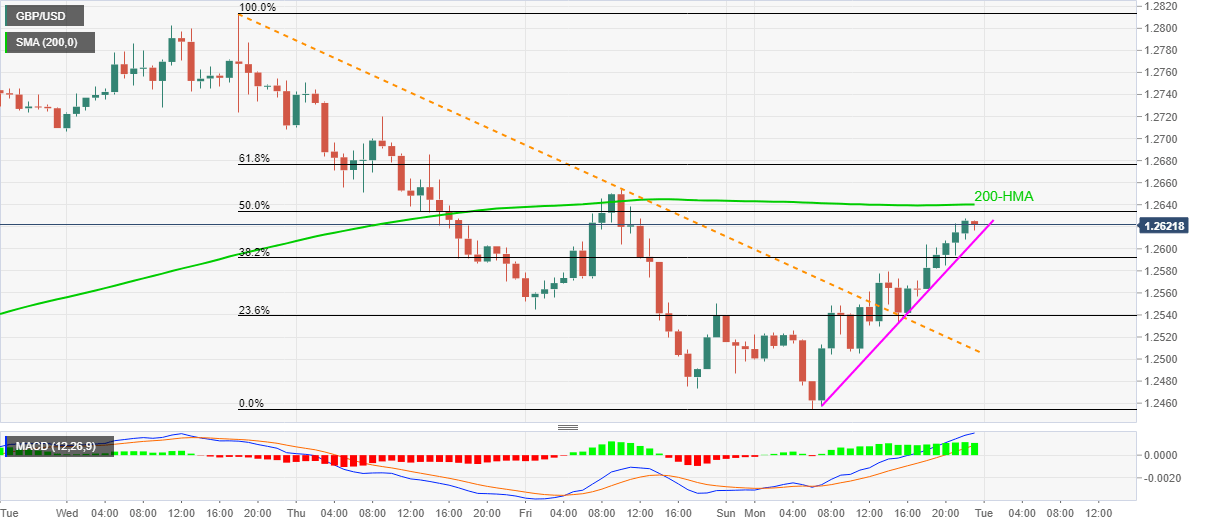
Trend: Pullback expected


