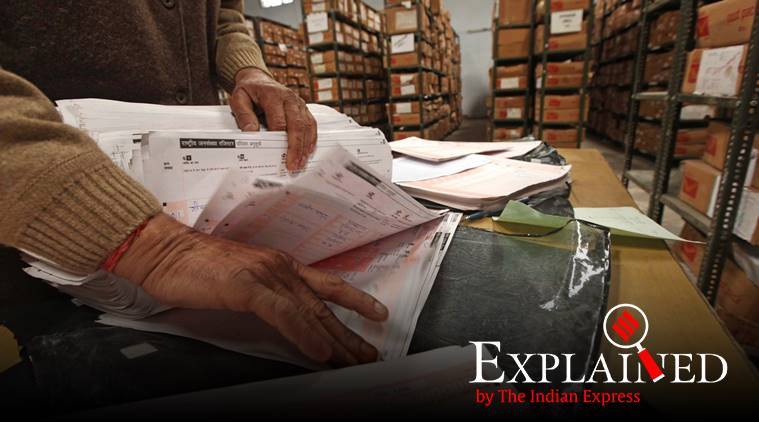
 Census forms are manually checked. With Covid-19, there is a remote chance of the Houselisting & Housing phase taking off immediately. (Express File Photo)
In 2009-10, the National Sample Survey Office (now National Statistical Office or NSO) conducted a large sample survey of Household Consumer Expenditure (HCE). This survey, usually carried out once in five years, was repeated in 2011-12. The reason: 2009-10 saw India suffer both a severe drought and the aftereffects of the global financial crisis. 2011-12 was a “normal” year like 1999-2000 and 2004-05, “free” from any major economic downturn.
2011-12 not only yielded the HCE survey data used for estimating poverty lines and ratios: Households with consumption expenditure below a certain level, which is state-specific and different for rural and urban areas, are considered poor. That period produced a surfeit of information also from other sources – the 2011 Census, NSSO’s Employment and Unemployment Survey (EUS), and the Rural Development Ministry’s Socio Economic and Caste Census (SECC). Policymakers and researchers were, simply put, spoilt for choice with regard to official data availability.
Contrast these to the present times where there’s a virtual data vacuum. The NSO did carry out a HCE survey for 2017-18, but the Ministry of Statistics & Programme Implementation did not release its results citing “data quality issues”. Instead, it proposed conducting back-to-back HCE surveys in 2020-21 and 2021-22 “after incorporating all data quality refinements”.
WEBINAR: How badly bruised is India’s economy?
E-Xplained with Dr Rathin Roy [@emergingroy] , Director, National Institute of Public Finance and Policy, on challenges, options and trade-offs in the medium to long term
7 PM | May 26, 2020
Register here: https://t.co/p6E6Tc1vXO pic.twitter.com/by2SeRoevQ
— Express Explained (@ieexplained) May 22, 2020
The 2020-21 survey is supposed to start from July, which looks unlikely given the novel coronavirus-induced situation. “It is a massive exercise due to the size of the sample (101,651 households in 2011-12) and also questionnaire (covering the consumption of around 300 food and non-food items). The field investigators go to remote areas and spend roughly 2 hours with each household. Nobody can risk it this time, so we’ll have to wait for the 2021-22 survey,” said Pronab Sen, former Chief Statistician of India.
ExplainSpeaking | Why provisional GDP estimates due this week are crucial for India’s recovery
But it’s not just the HCE survey.
What else is uncertain
The Census, which collects individual-level demographic as well as socio-cultural, occupational, education and migration-related information, is scheduled to be conducted in February-March 2021. Prior to that, the first Houselisting & Housing phase – which looks at the amenities and assets possessed by households along with the condition of homes (construction material, number of rooms, etc) – was to take place during April-September 2020. There were question-marks over the launch of this phase even before the Covid-19 lockdown, especially as it was clubbed with the updation of the National Population Register opposed by many non-BJP ruled states.
With Covid-19, there is a remote chance of the Houselisting & Housing phase taking off immediately. The houselisting operation is crucial for carving out enumeration blocks or specific areas that are allotted to each of the 30 lakh-odd field functionaries tasked with collection of Census information. “We have postponed all the activities till further orders,” an official spokesperson told The Indian Express.
The same goes for the SECC, whose individual/household-level data, unlike that of the regular Census, isn’t confidential. The Narendra Modi government has used the SECC-2011 database for identifying beneficiaries under Pradhan Mantri Gramin Awaas Yojana (rural housing), Ujjwala (LPG connection), Saubhagya (household electrification), Ayushman Bharat (health insurance) and other welfare schemes. But the SECC-21, too, cannot be undertaken without the demarcation of enumeration blocks as part of the Census houselisting operation.
Even assuming the current uncertainty to be temporary, the considerable time lag before the release of the next HCE survey, Census and SECC findings leaves very few relatively recent sources of primary survey data for enabling informed policymaking. Yes, there is the Agriculture Census 2015-16, the NABARD All-India Rural Financial Inclusion Survey 2016-17, and the NSO’s 2017-18 reports on social consumption (health and education) and access to drinking water and sanitation. But they don’t answer basic questions: Has poverty in India fallen and by how much since 2011-12? Is consumption of protein-rich foods and vegetables growing at the same rate as in the previous decade? Do official production estimates for milk or horticultural crops square up with HCE data on household consumption?
What this can lead to
The economic crisis, particularly post lockdown, only further complicates matters. With neither 2020-21 nor 2021-22 set to be “normal years”, any official survey may throw up distorted results, such as a dramatic drop in HCE. The 2017-18 HCE survey report itself was allegedly withheld because it showed rural consumption declining in real inflation-adjusted terms over 2011-12 amid high farm distress. The upcoming Census could also give a distorted picture with regard to migrants, whose share in India’s population rose from 29.9% to 37.6% between 2001 and 2011.
“The Census considers a person a migrant if he/she, on the date of enumeration, is at a place different from his/her place of birth. In an unusual year such as this, where many migrant workers have gone back to their villages, you might end up with something different from the actual overall decadal trend,” noted Sen.
However, Mahesh Vyas, managing director of Centre for Monitoring Indian Economy (CMIE), believes that the government should continuously do surveys without waiting for normal years. “Finding these is becoming increasingly difficult. In 2016-17, there was demonetisation. In 2017-18, it was goods and services tax. 2018-19 and 2019-20 were apparently normal, but this year you again have lockdown,” he pointed out.
Explained | Now online, a map tracking migrants, real time
The NSO’s more recent Periodic Labour Force Surveys (PLFS) have broken new ground by producing annual estimates of employment and unemployment in both rural and urban India (as opposed to the five-yearly EUSs till 2011-12), along with quarterly figures for only urban areas. But so far, only the PLFS for 2017-18 has been released. For 2018-19, quarterly data is available till January-March 2019, while restricted to urban areas. The one significant trend these reveal is a drop in the proportion of India’s population aged 15 years and above currently employed or seeking work – the so-called labour force participation rate (LFPR) – from 55.9% in 2011-12 to 49.8% in 2017-18.
CMIE, which is a private data provider, has been compiling all-India weekly LFPR and unemployment rate numbers since January 2016. Its Consumer Pyramids survey claims to cover 174,405 households in four-month periods (Jan-Apr, May-Aug and Sep-Dec), more than the 102,113 that the NSO’s 2017-18 PLFS did over one year.
📣 Express Explained is now on Telegram. Click here to join our channel (@ieexplained) and stay updated with the latest
“We do about 43,600 households in a month and 10,900 every week. Since the survey data collected from our panel households using handheld GPS-enabled devices is uploaded and validated the same day, we are able to generate reliable weekly rates. Our estimates are consistent with the trend captured by the PLFS. Post lockdown, we have seen both falling LFPR and rising unemployment rates (calculated as a percentage of the labour force,” added Vyas.
But CMIE’s sample households are also selected from enumeration blocks that are based on the Census. “If the next Census shows new towns with higher population growth, our sampling frame has to reflect that. And enumeration is something that only the government can do,” admitted Vyas.
📣 The Indian Express is now on Telegram. Click here to join our channel (@indianexpress) and stay updated with the latest headlines
For all the latest Explained News, download Indian Express App.
© The Indian Express (P) Ltd


