
- Gold has pushed slightly higher today but it has been a slightly lacklustre session.
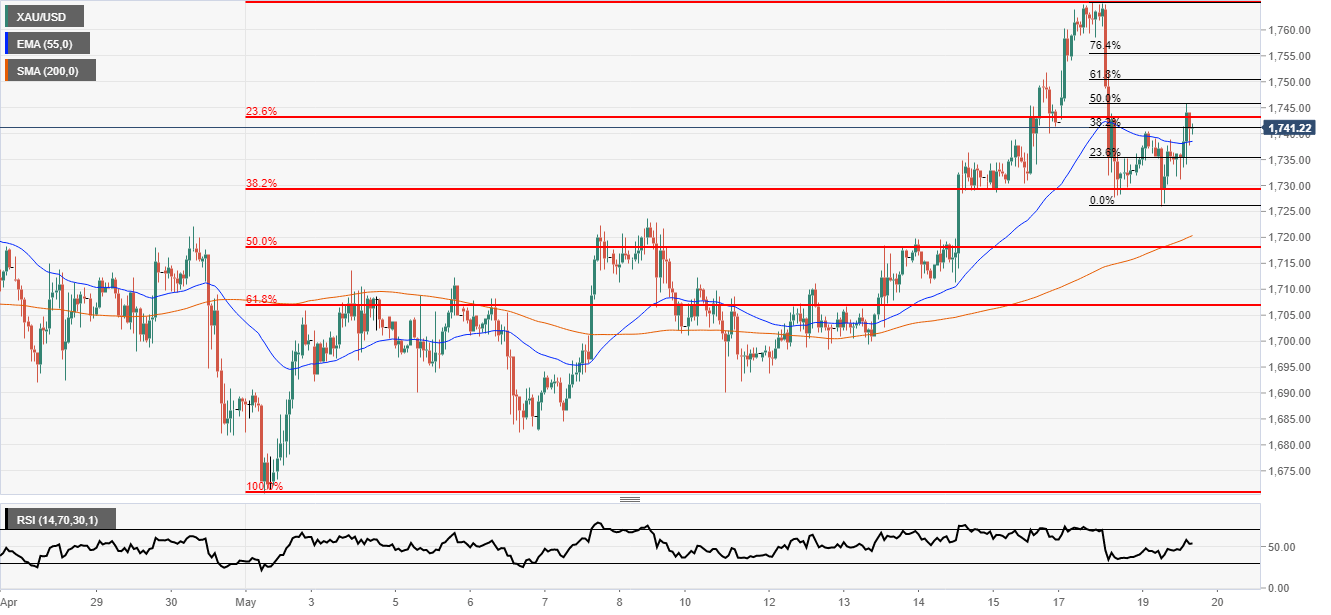
- The Fibonacci retracement area of 38.2% held firm as the main support zone.
Fundamental backdrop
The risk sentiment in the macro markets is slightly mixed today as the Nasdaq trades higher but the rest of the main EU and US bourses trade in the red. This comes after a bumper few sessions where the negative risk tone was reversed when the news of a vaccine hit the markets. Oil has also been steadily pushing higher over the last four trading session putting some of the petroleum companies back on track. This has led gold to pull away from its best level but Tuesday has been calmer and the precious metal trades 0.46% to the good.
Fed Chair Powell has been on the wires today and he said that the virus and more specifically employment will weigh on the economy for years. If there is additional stimulus it would depend on the path of the economy and the Fed must ask themselves if what they have done is enough for the economy in the months ahead. That was not all from the US central bankers as Mr Predictable (Kashkari) said the Fed has other tools to use if before it uses negative rates and strong US GDP growth is probably two years away, nothing we have not heard before.
From the White House, US treasury secretary Mnuchin stated the job numbers are likely to get worse before they get better. However, there was some good news as Economic Advisor Kudlow said the WH is looking at a corporate tax cut.
In the UK it was more doom and gloom from the Chancellor Rishi Sunak as he confirmed that the UK is facing a recession “the likes of which we haven’t seen”. The UK is not the only nation in trouble as the Bank of Japan called an unscheduled monetary policy meeting to discuss new measures to provide funds for banks (May 22nd).
Technical picture
Looking at the hourly chart the main support area in the short term seems to be the 38.2% Fibonacci zone. The 50% looks like the stronger area as there is some support level confluence but the price didn’t manage to get that low. Away from this, the 55 exponential moving average has been somewhat of a pivot point as the price has moved through the EMA on a few quick occasions.
There is a key level to watch if this is going to be a more sustained move to the downside. The black Fib retracement of 61.8 – 76.4% is key. If a new downside Elliott Wave pattern is to emerge then a rejection of one of these levels could be a clue that the move lower could be deeper than expected. At this point a break of the aforementioned 38.2% Fib support will become a very important sign.
Additional levels


