
BNB Price Analysis – April 3
The Binance Coin has once again turned towards a bullish path and may soon break the $15 mark if it continues to move with the same momentum.
BNB/USD Market
Key Levels:
Resistance levels: $16, $18, $20
Support levels: $11, $9, $7
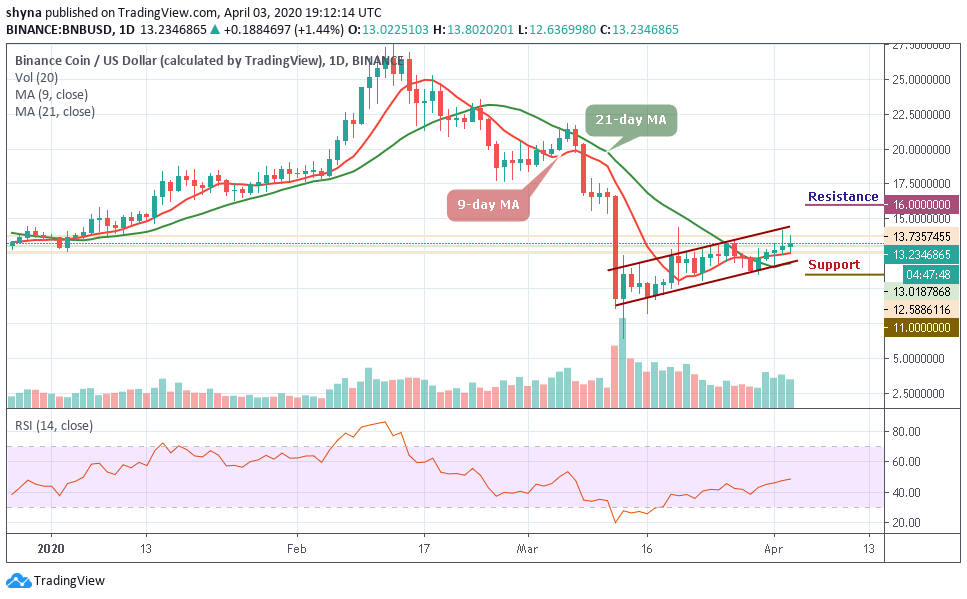
The Binance Coin (BNB) remained in a good uptrend after touching the key resistance zone of $13.73. BNB price has exceeded the level of $13 and it is currently consolidating the gains. The coin has shown a bumpy trend in the last one day when it started trading at $13.01 and then dipped as low as $12.58. The coin quickly picked up the pace above the 9-day and 21-day moving averages and then surged as high as $13.73 before dipping back to $13.23.
Today, looking at the upside, the $16, $18 and $20 levels are significant resistance levels while on the downside, if the price experience a break below the $12 level, it could cause a bearish wave and beneath this, further supports could be found at $11, $10 and $9 levels. Meanwhile, the RSI (14) focuses on the upward movement as the signal line moves above 47-level.
BNB/BTC Market
Against Bitcoin, the recent stunning rise has made the buyers retest the 0.0026 BTC resistance. If this wave continues, the BNB/BTC pair may further display a green build-up following a bullish movement but any contrary movement towards the south may push the price to support levels of $0.0018 BTC and below.
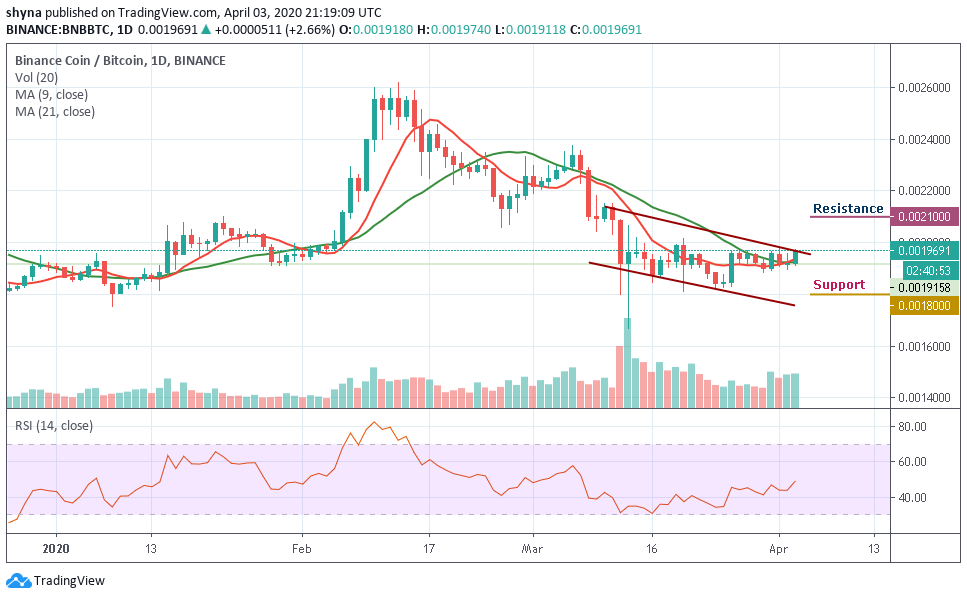
Meanwhile, the BNB price is trading within the descending channel and waiting for a break out of the channel. More so, with the current movement, if the price move above the 21-day moving average and climb the upper limit of the channel, it may likely reach the potential resistance levels at 0.0021 BTC and above.
Please note: Cryptovibes.com is not a financial advisor. Do your research before investing your funds in any financial asset or presented product or event. We are not responsible for your investing results.


