
- XAU/USD had a massive bull-run last week as the Fed announced no limit to its bond-buying scheme.
- XAU/USD is breaking below the 1600 mark.
XAU/USD daily chart
XAU/USD is consolidating the bullish run stemming from 2020 lows while challenging the 50 DMA (daily simple moving average).

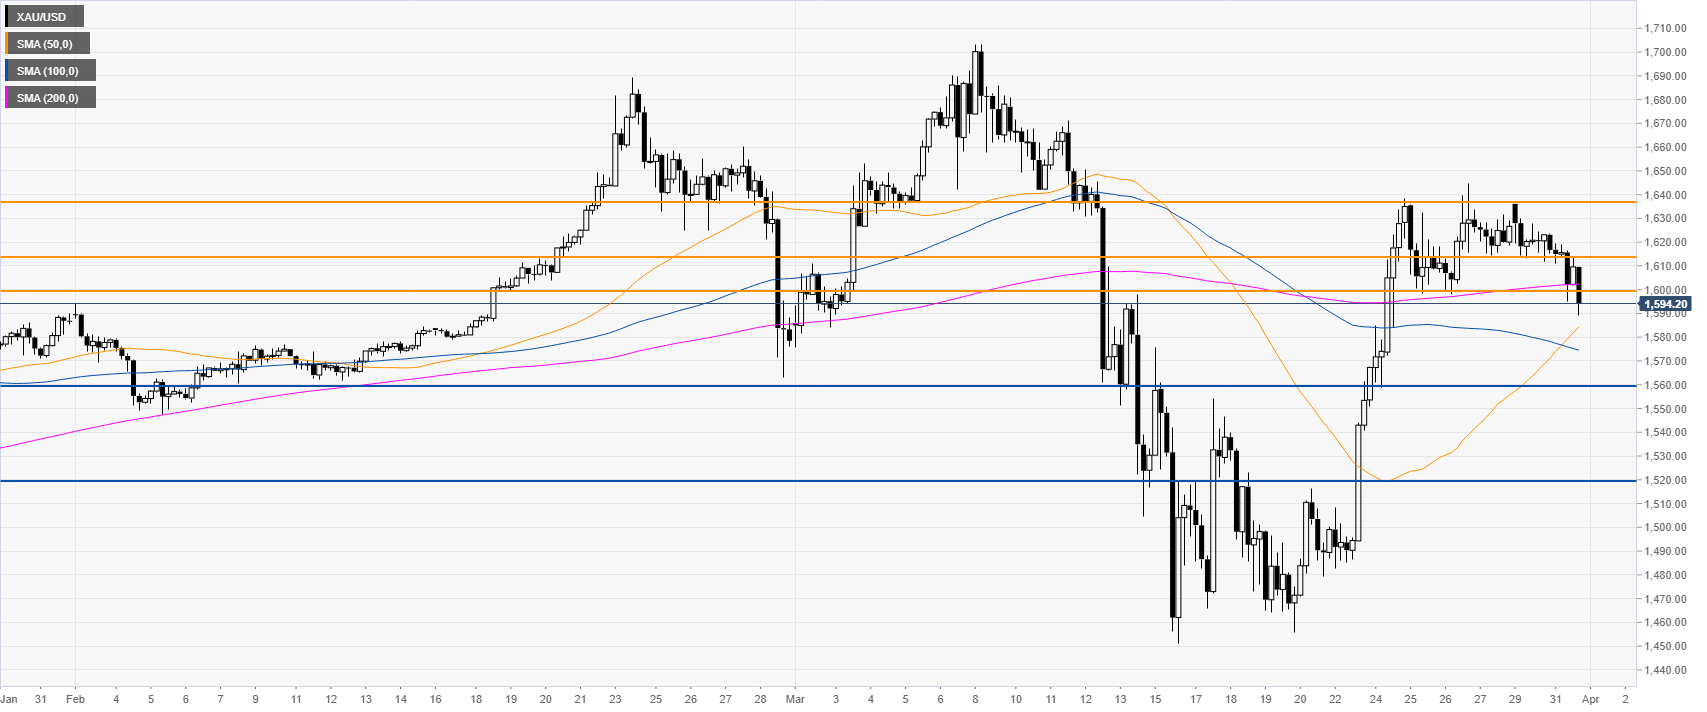
XAU/USD four-hour chart
Bears seem to have taken over as the market is losing the 1600 support and the 200 SMA. A daily close below the 1600 mark could be seen as bearish with a potential decline towards the 1560 and 1520 levels in the medium term. Resistances are seen near the 1600, 1614 and 1636 levels on the way up.
Additional key levels


