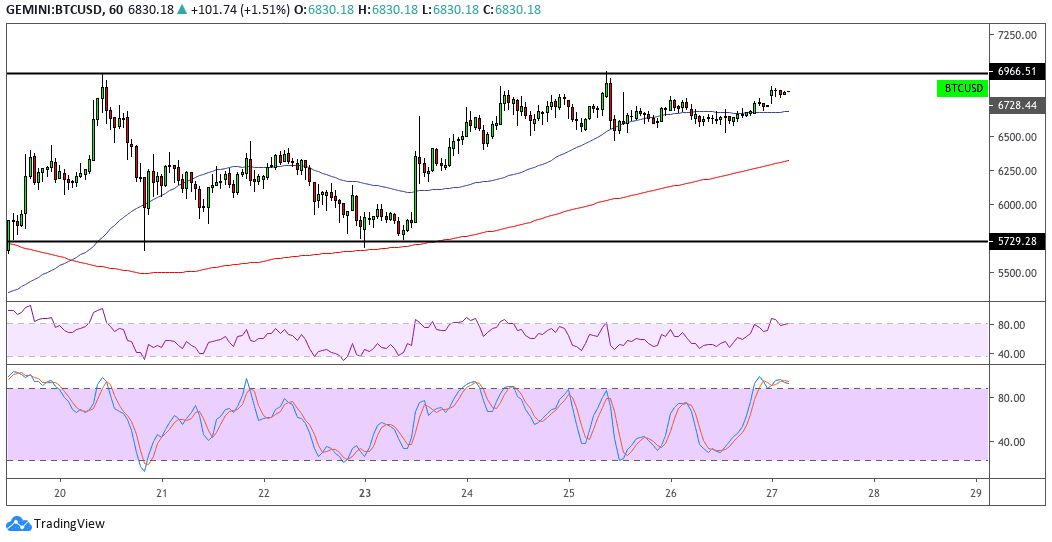
Bitcoin continues to trade sideways in a tight short-term range, which happens to be close to the top of another larger range. If resistance keeps holding, a move to the bottom of the big range at $5,725 could follow.
The 100 SMA is above the longer-term 200 SMA, though, so the path of least resistance is to the upside. In other words, resistance is more likely to break than to hold, possibly resulting to a rally that’s the same height as the rectangle. This formation spans around $1,250 in size, and price is finding support at the 100 SMA dynamic inflection point for now.
RSI is already indicating overbought conditions, though, and turning lower could signal a return in selling pressure. If so, a test of the bottom of the short-term range could determine where bitcoin might be headed next. A break below this could set off a slide to the next support at the 200 SMA dynamic inflection point. Stochastic is also in the overbought zone to signal exhaustion among buyers and a likely return in selling pressure.

Bitcoin traders are holding out for the next major market catalyst, and it looks like the recent US stimulus efforts aren’t doing the trick. The dollar is on weak footing against other fiat currencies so far, though, as the anticipation for the approval of the aid package is fading. In that case, bitcoin might be poised for an upside breakout, especially if risk aversion persists but does not favor the US currency.
Also note that the halving could be a major reason for investors to flock back to bitcoin at some point, especially as the event draws near. Many predict that this could lead to double the value of the coin in a span of a few months, particularly if demand picks up.
Images courtesy of TradingView


