
In high-volatility markets like the one we’re in now, low-volatility investing can offer considerable comfort. But it can also offer excess returns. In this article, I’m going to single out six basic factors (and their variations) that investors should explore when designing a low-volatility model, and I’m going to present an actual model on Portfolio123.com that can form a good basis for your investments.
1. Low price volatility. This is simply the standard deviation of daily (or weekly) returns. Stocks that are stable and steady in terms of price volatility tend to remain that way.
2. Low volume volatility. Once again, choose stocks with low standard deviation of volume to be really safe.
3. Beta. Beta is a rough measurement of how closely a stock’s movements resemble those of the market as a whole. Alpha is a measurement of excess returns after beta is taken into account. Beta is the slope of the linear regression between the stock’s weekly or monthly price movements and those of the market, and alpha is the y-intercept. If a stock’s beta is 1, then one should expect that when the market goes up or down 2%, the stock will go up or down 2% plus its alpha. If its beta is 2, when the market goes up or down 2%, the stock will go up or down 4% plus its alpha. If its beta is close to 0, the stock will act completely independently of the market. And if the stock’s beta is –1, when the market goes up 2%, the stock will, on average, go down 2% plus its alpha. The lower the beta, the more uncorrelated the stock is to the market, and portfolios with low correlations between stocks have much less variance than those with high correlation. As a bonus, beta and alpha are negatively correlated (I’ve written a mathematical proof of this), so low-beta approaches tend to produce high alpha.
4. Low share turnover. This is the number of shares traded divided by the number of shares outstanding. I have written on this factor at length, but if you don’t want to read my article, here’s a nutshell version.
Older, established, and somewhat boring companies (widows and orphans), often with high-priced shares and low short interest, have low share turnover; and cutting-edge, exciting, controversial, highly hyped, turnaround, high-momentum, and/or heavily shorted companies have high share turnover. Stocks with lower share turnover are less subject to market shocks, and the higher their turnover, the more they’ll be moved by the market. In other words, low-turnover stocks have lower beta and high-turnover stocks have higher beta.
Why? Prices and quantities traded are driven by the same forces. And it almost goes without saying that without a large increase in volume, you simply can’t have a large increase or decrease in price.
If you multiply both the top and bottom of the share turnover formula by the price per share, in the numerator you get dollar volume—the amount of money actually exchanging hands—while in the denominator you get market cap. Put everything together and you can see how the price movements in the cap-weighted market as a whole are going to be much more heavily reflected in stocks that experience a high dollar volume compared to their market cap than in stocks that experience a low dollar volume, simply because volume amplifies market-related price movements. Share turnover—average dollar volume divided by market cap—is essentially a measure of investor participation in a company. And higher investor participation will be associated with a larger amount of capital responding to common shocks. Thus, other things being equal, a larger amount of capital responding to a common shock will result in a stronger price movement.
5. Low fundamentals volatility. I have found that a number of measures of stability can help reduce volatility and increase returns. In particular, look for stocks with stable accounts receivables, assets, cash conversion cycle, cash flow, employees, income, margins, sales, and so on.
6. Large size. Large companies tend to be far more stable than small companies. The measure of size with the lowest negative correlation to volatility is market cap, with sales coming a close second, so companies with large market caps and high sales are good low-volatility investments.
I’ve designed a relatively simple ranking system that combines all these factors for a comprehensive low-volatility approach. If you’re a Portfolio123 subscriber, you can link to it here. If you’re not, a screen shot of it is below.
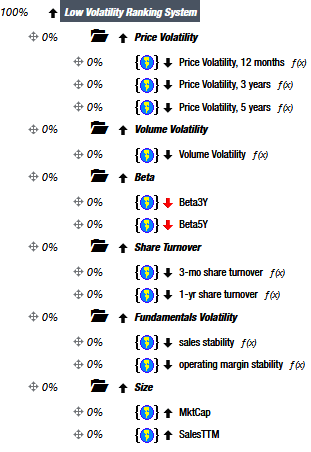 I’ve put in two fundamental factors as examples of how to minimize fundamentals variance, but feel free to add others. I haven’t assigned weights to any of the factors: please feel free to copy this system and assign weights as you see fit. You can backtest the system with this screen. You’ll see that a 50-stock portfolio of Russell 1000 stocks gets solid excess returns over the last five, ten, and fifteen years, with much higher Sharpe ratios and much lower beta and standard deviation than the S&P 500. I’m sure you can improve these results by adding screening rules and varying the weights of the ranking system.
What kind of stocks does this system recommend? Right now, the top five stocks are Republic Services (RSG), CNA Financial (CNA), Kimberly-Clark (KMB), Ecolab (ECL), and Procter & Gamble (PG). Boring companies all. And safe, too.
Academics have long puzzled over the fact that low-volatility stocks have higher returns than high-volatility stocks. It goes completely against their theory that higher risk should be compensated with higher returns.
But in fact, high risk does not correlate with high returns. Risk and return do have a relationship, but it’s not linear, and is shaped more like the top of a right-facing baseball cap. If you’d like to read more about this, I’ve written a short article here. By using a low-volatility approach, you can both reduce your risk and increase your returns.
My marketplace service, The Stock Evaluator, comprehensively ranks close to 5,000 stocks weekly based on a sophisticated multi-factor system with deep roots in accounting and valuation methods. It has a terrific out-of-sample record: over the 22 months since the service began, high-ranked stocks have consistently outperformed the market while low-ranked stocks have massively underperformed it.
Disclosure: I/we have no positions in any stocks mentioned, and no plans to initiate any positions within the next 72 hours. I wrote this article myself, and it expresses my own opinions. I am not receiving compensation for it. I have no business relationship with any company whose stock is mentioned in this article.


