XLM Price Analysis – February 15
After the coin has maintained a serious upward movement in the past weeks, the bulls suffered a serious downtrend today as the price crosses below the moving average.
XLM/USD Market
Key Levels:
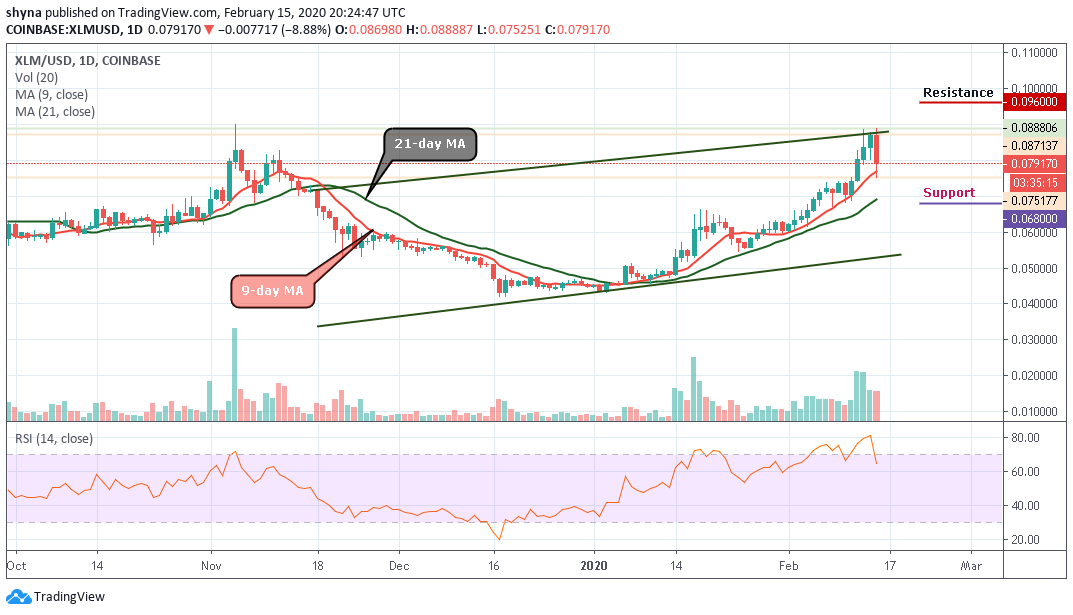
Resistance levels: $0.096, $0.098, $0.100
Support levels: $0.068, $0.066, $0.064

XLM/USD is indicating a downtrend in the market moving below the 9-day moving average before a rebound. Today, the coin has been bitten by the bear and once again the expectations of upsurge are ruined. Traders were quite apprehensive about the progression of the coin, but it looks like Stellar (XLM) would take time to improve.
However, as the stellar (XLM) price remains firm within the channel, we await the possible direction of XLM. More so, for a positive peak, the $0.096, $0.098 and $0.100 are the main resistance levels at the moment. Meanwhile, the technical indicator reveals that the RSI (14) gives a sharp drop from the overbought zone. As a result, a negative spike may test the critical support at $0.068 and $0.066 before a slippage of $0.064.
XLM/BTC Market
Comparing with Bitcoin, the pair is still trading on the upside and currently trading above the 9-day and 21-day moving average at 803 SAT. If the bears continue to push the coin to the south, Stellar (XLM) may likely see a sharp drop at 750 SAT support level. Breaking this level could further drag the market to other support levels at 700 SAT and below.

Moreover, as long as 9-day MA is still above the 21-day MA, XLM/BTC may likely revisit the upward movement which could reach the potential resistance at $900 and above. Since the Stellar (XLM) has shown great potential in the past, the recovery is underway and in no time, traders would see Stellar booking huge profits.
Please note: Cryptovibes.com is not a financial advisor. Do your research before investing your funds in any financial asset or presented product or event. We are not responsible for your investing results.


