ETC Price Analysis – February 10
At the time of writing this, Ethereum Classic has recorded a downtrend of 1.94%, in the last 5 days; the coin has declined from $12.3 to its current value at $11.50.
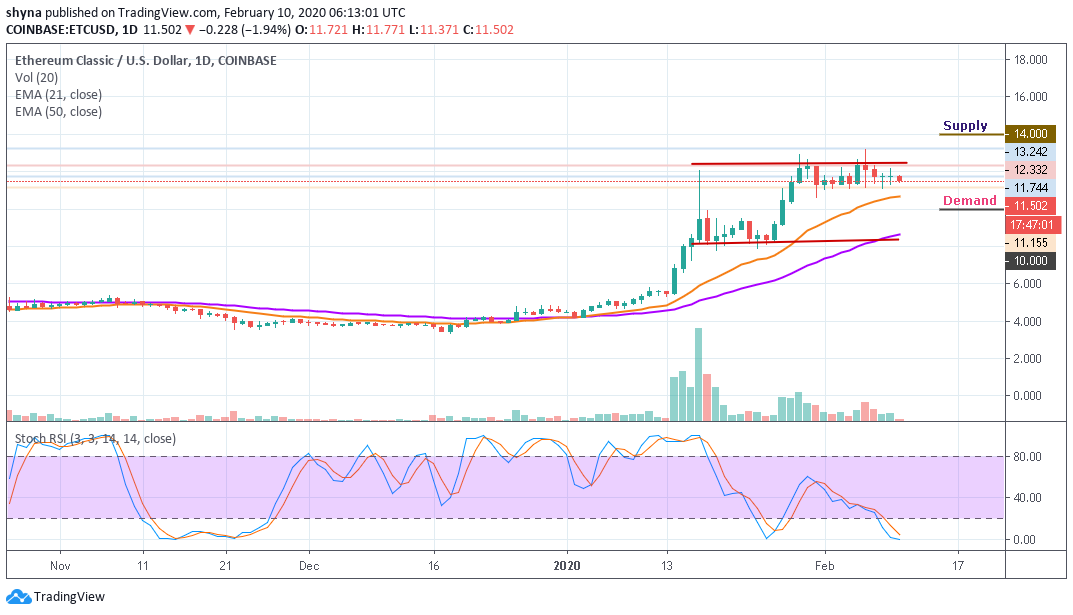
ETC/USD Market
Key Levels:
Supply levels: $14.0, $15.0, $16.0
Demand levels: $10.0, $9.0, $8.0

A few days ago, after touching the supply level of $13.32, Ethereum Classic retested the $11.15 support. ETC/USD has managed to stand ground in the on-going bearish trend in the crypto market. More so, the past one-week price trend has seen the coin moving in a flattish range within the baseline price of $11.3 – $12.3.
However, if the ETC/USD pair breaks below the 21 periods EMA, traders may expect immediate demand at $10.0, $9.0 and $8.0 levels. On the other hand, a bounce-back could regroup buyers for the key supply levels around $14.0, $15.0 and $16.0. Considering the current market condition, the token is obeying the trend line at the moment as the stochastic RSI stays within the oversold zone.
ETC/BTC Market
Comparing with Bitcoin, after a few days uptrend, ETC price has been dropping and may likely cross below the 21 periods EMA as the coin continued the bearish run at the moment. The next level of demand may surface at 1100 SAT and then locate further key support at 1000 SAT and 900 SAT levels if the sell-off later becomes huge.
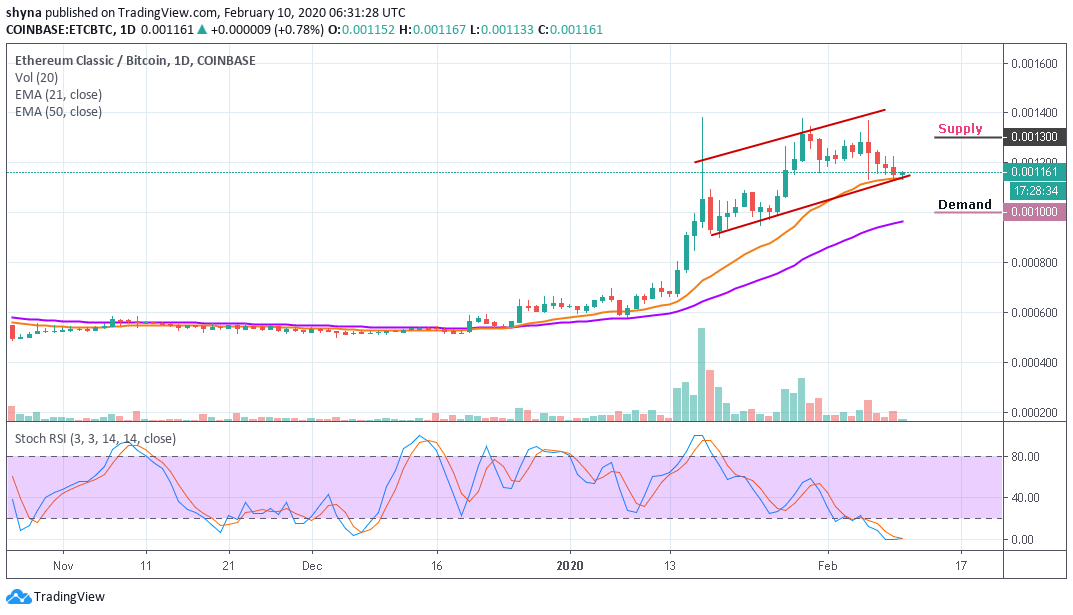
However, on the upside, if the bulls can gather enough momentum to push the price and face the north, Ethereum Classic could face the 1250 SAT supply. Above the mentioned supply lies the major 1300 SAT and above. The stochastic RSI indicator moves tremendously within the oversold condition and if the indicator remains in this zone, traders may expect more bearish pressure below the channel.
Please note: Cryptovibes.com is not a financial advisor. Do your research before investing your funds in any financial asset or presented product or event. We are not responsible for your investing results.


