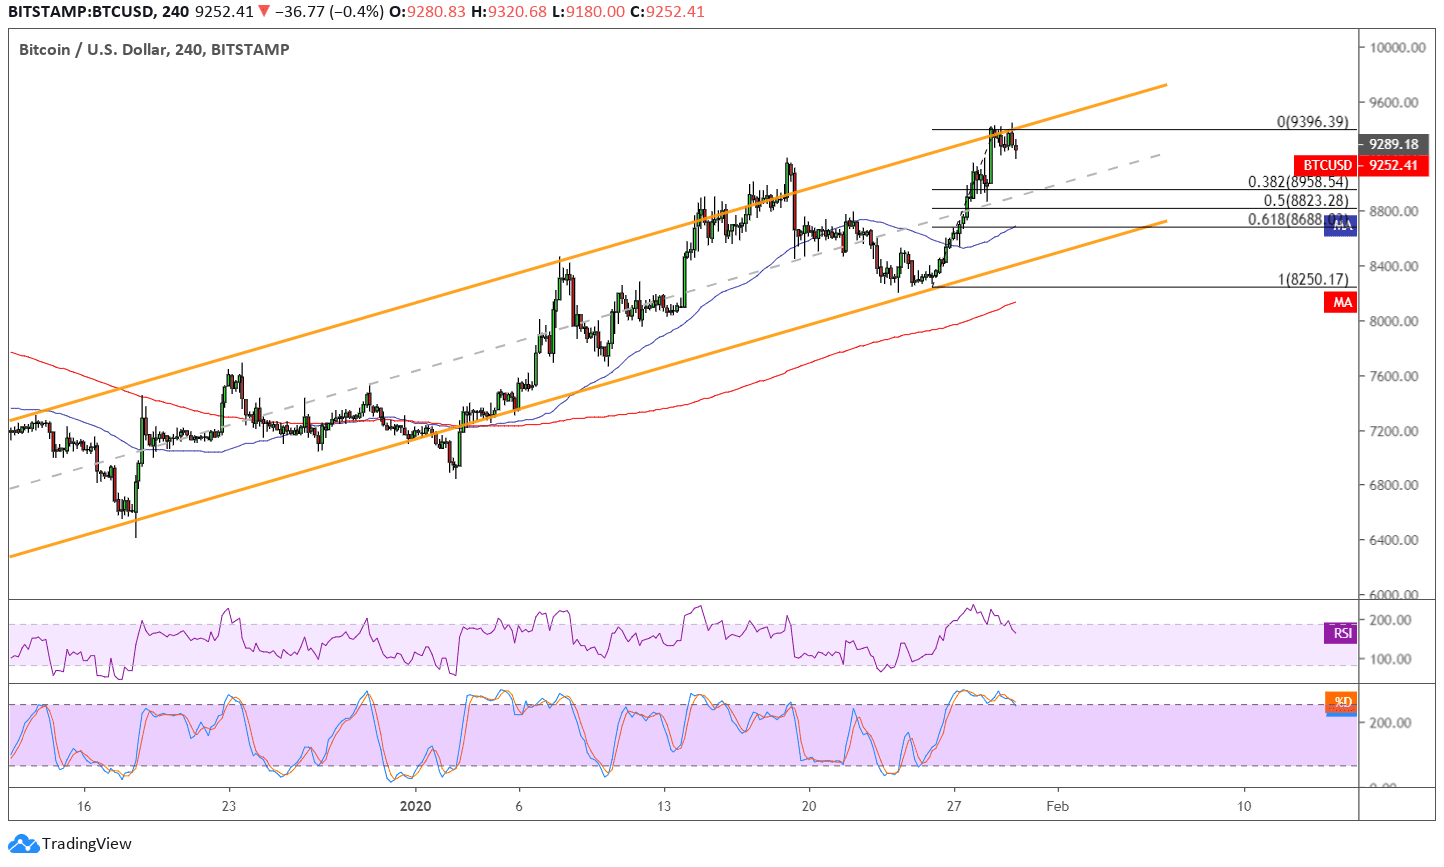
Bitcoin has formed higher lows and higher highs on its 4-hour time frame to trade inside an ascending channel. Price is currently testing the resistance and a bounce could take it back to support.
Applying the Fibonacci retracement tool on the latest swing low and high shows that the 61.8% level is in line with the channel bottom around $8,688 and the 100 SMA dynamic inflection point. The 38.2% level is close to the mid-channel area of interest and might be enough to hold as near-term support around $8,958.
The 100 SMA is above the 200 SMA to confirm that the path of least resistance is to the upside or that the climb is more likely to gain traction than to reverse. The gap between the indicators seems to be maintained to reflect the presence of bullish momentum. The 200 SMA is just below the channel bottom to add another layer of support in the event of a deeper pullback.
RSI is turning lower after recently reaching the overbought region, indicating that selling pressure could be picking up from here. Stochastic is also indicating overbought conditions and is starting to turn lower to signal a pickup in selling momentum. Once both oscillators reach the oversold region and turn higher, buyers could return and allow the uptrend to resume.

Bitcoin is drawing support from the risk-off flows in financial markets these days as stocks and commodities are taking hits due to the coronavirus in China. This could potentially dampen overall growth in the country and therefore weigh on business sentiment and demand. In turn, this is driving traders towards higher returns in alternative markets like cryptocurrencies.
Meanwhile, traders continue to wait on the halving of mining rewards in May, with the expectation of seeing twice as much value in bitcoin over months or years.
Images courtesy of TradingView


