

ELAZIG, TURKEY – JANUARY 25: Teams conduct a search and rescue operations for survivors of a … [+]
“The last decade was the most expensive for natural disasters,” proclaimed Fox News, “over $1 trillion increase.” The Weather Channel announced, “Planet Had 40 Billion-Dollar Weather Disasters in 2019, the Fourth-Most on Record.” However, a close look at the insurance industry report that produced these incredible claims reveals some serious data issues and offers some lessons for when academics and the media should rely on insurance industry data on catastrophes.
I have studied the economic costs of disasters and their relationship to changes in climate for more than 25 years. One dataset that I have relied on in my research in recent years has been released by the insurance broker Aon in the form of an annual global catastrophe report, the most recent which was released last week. (Disclosure: I have in the past given several talks at Aon conferences and I co-authored a paper with one of the main authors of the new Aon report).
The new Aon catastrophe report immediately raised concerns for me because it reported about $3 trillion in catastrophe losses for the most recent decade, 2010 to 2019, whereas Munich Re, which has been tracking global catastrophe losses for many decades, reports only about $2 trillion in total catastrophe losses over the same period.
Catastrophe loss estimation involves many uncertainties, and Aon explains in their report that they engage in a process of “reanalysis” to confirm past estimates. That makes good sense, but a $1 trillion difference between the estimates of Aon and Munich Re cannot be the result of small differences in loss estimation or a historical reanalysis.
Curious, I explored further, and what I found is extremely troubling, and offers some lessons for all of us who rely on industry data in our work.
I compared the annual catastrophe loss estimates for 2000 to 2018, as published by Aon one year ago in its look-back at catastrophes of 2018, with estimates for the same years that are included in its new report published last week, looking back at 2019. Much to my surprise the loss estimates for all of these years had changed, and not by just a small amount.
For weather-related disasters, which comprise the majority of historical losses and understandably are at the focus of discussions of climate change, Aon revised upwards loss estimates in each year. The total increase in reported losses over the past decade from last year’s report to this year’s report was more than $250 billion, after accounting for inflation. That is a huge number — equivalent to three times the total economic losses Aon reports for Superstorm Sandy of 2012.
Even more troubling, the increases in annual loss estimates are grouped in more recent years, with loss estimates from 2013 to 2018 increased by $133 billion, in just the past 12 months. The figure below shows the changes to Aon’s catastrophe loss estimates from 2000 to 2018 from last year’s report to the one released last week.
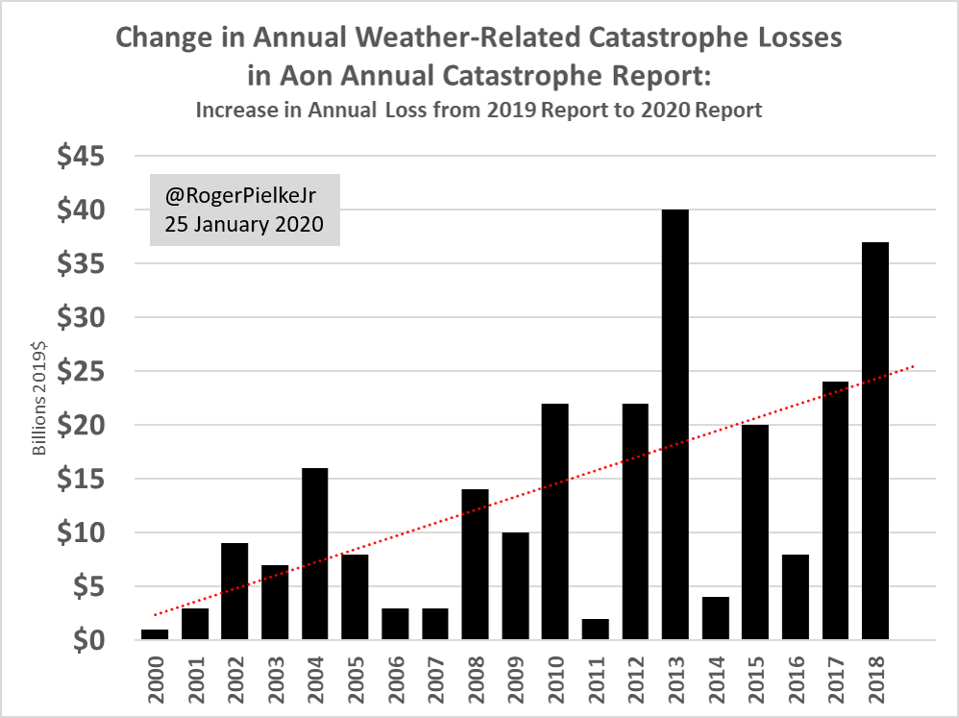
Change in annual weather-related catastrophe losses in Aon annual catastrophe report from 2019 to … [+]
There is also a large trend in the size of the changes, which runs counter to expectations of loss estimation techniques, as well as plain old common sense. Catastrophe losses have been increasingly well and more comprehensively reported in recent years than in the past. The notion that more recent data suddenly needs major adjustments, while data from almost two decades ago was largely accurate just doesn’t make sense.
Via Twitter, I asked one of the lead authors of the new Aon report, Steve Bowen (with whom I had co-authored a paper on hurricanes a few years ago), about these massive year-to-year changes in their data over the past 12 months. He kindly responded right away.
I asked him to explain the specific reasons why the loss estimates had increased so dramatically in such a short amount of time. He responded in two ways.
First, he pointed out “loss development” in insurance, as claims come in over an extended amount of time and could result in adjustments to loss totals. That is true, however, of the >$250 billion increase in losses over the past decade that appeared in the new Aon report, only about $20 billion of that increase is in insured losses, or about $2 billion per year. So that doesn’t explain much.
Second, Bowen cited one event, the 2013 Amur Basin Floods in Russia and China, and suggested that this catastrophe was initially estimated to be a $3 billion loss, which was later revised upwards to “north of $20 billion” based on “government reports.” However, in contrast to Bowen’s claim, an official Russian government study of the economic losses of that flood conducted several years later reported totaled losses of $4.7 billion for the floods, and included some dubious items like economic losses associated with “soil quality.”
Even further, the entire region in Russia and China where these 2013 floods took place was home to just 170,000 people, which would imply a loss of about $120,000 per person for a total event loss of $20 billion. In comparison, the per capita loss associated with Hurricane Harvey’s massive flooding in Houston (a $130 billion event according to Aon) was less than $20,000.
You don’t have to be a catastrophe expert to understand that economic losses from flooding in a sparsely populated, poor region along the China-Russia border are not going to be six times greater per person than those in one of the largest metropolitan areas of the United States. I asked Bowen for the Russian government report he was referring to, and he did not respond.
I explored in more depth the recent changes to the Aon global catastrophe record by comparing the Aon loss estimates to those that Munich Re produces each year, and which I have recently used in research alongside the Aon loss estimates. The loss estimates of Munich Re are the most widely used in research and assessment reports, and one reason for this is that Munich Re makes their complete dataset available to researchers.
The comparison of Aon loss estimates and those of Munich Re is remarkable, and can be seen in the figure below.
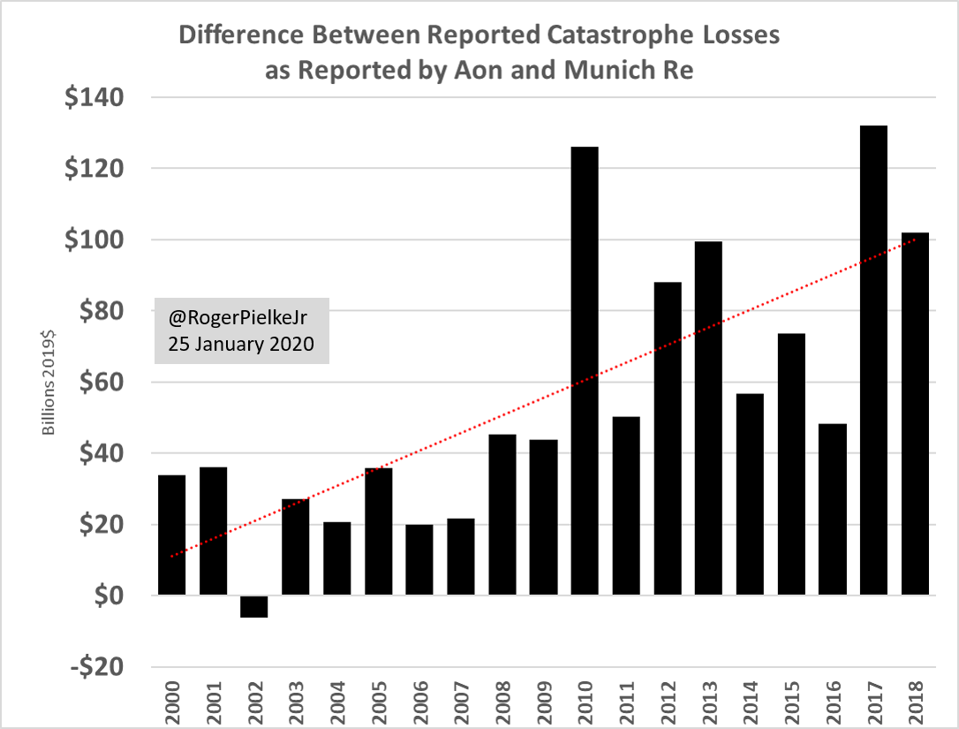
Difference between reported annual catastrophe losses as reported by Aon and Munich Re, 2000 to … [+]
The differences in reported global catastrophe losses between the two companies are much larger in recent years, exceeding $100 billion in four years of the past decade. In total, over the period 2000 to 2019, Aon reports about $860 billion more in weather-related catastrophe losses than does Munich Re.
The idea that one of the world’s oldest and largest reinsurance companies would have failed to notice more than $850 billion in weather-related catastrophe losses is simply implausible.
To get a better sense of what might be behind these significant data quality issues, I contacted Aon with some specific questions requesting some details on the reasons behind the large changes in their dataset over the past 12 months. Their response ignored my specific question, and responding in mostly corporate speak.
An Aon spokesperson commented, “Aon is committed to analysing global natural disaster events to identify trends, manage volatility and enhance resilience. Our robust methodology includes extensive research that captures publicly available data via numerous public and private sector organizations. A global team of researchers identifies regional losses and collectively aggregates these to ensure an accurate view of loss costs. We have further enhanced our approach through our ongoing multi-year reanalysis project to fill in historical data gaps from previously under-reported regions and perils. The discovery of new events or an update of previously-identified events – plus the standard practice of loss development following large scale disasters – can, and will, result in annual variability in loss statistics. This brings greater accuracy, lowers uncertainty and delivers more insightful trends.”
I asked Aon specifically for the data that would explain the changing loss values from 2019 to 2020, and which would unambiguously resolve questions about why the numbers changed so dramatically over just one year.
Aon refused to provide that data: “While our underlying data is proprietary and the firm’s intellectual property, we are dedicated to sharing in-depth numbers and analysis (including some 80 exhibits in this year’s annual report) to help reduce vulnerabilities and build resilience from natural catastrophes for communities, governments and business around the world.”
Whatever is going on here, it is clear that the Aon catastrophe dataset is not suitable for analysis of trends in losses, much less for academic research. Going forward, I will drop Aon data from my research and suggest that other researchers and the media exercise extreme caution in using it. I will continue to rely on Munich Re, which follows more robust practices for data transparency and sharing, most notably, making their data available to researchers.
Such practices of course don’t guarantee that the Munich Re data is without errors or flaws. But what it does mean is that when we have questions about the data, we have the ability to obtain the information needed to answer them.


