- Bitcoin has confirmed a bull breakout on longer duration charts.
- The cryptocurrency is consolidating in a narrow range on the hourly chart.
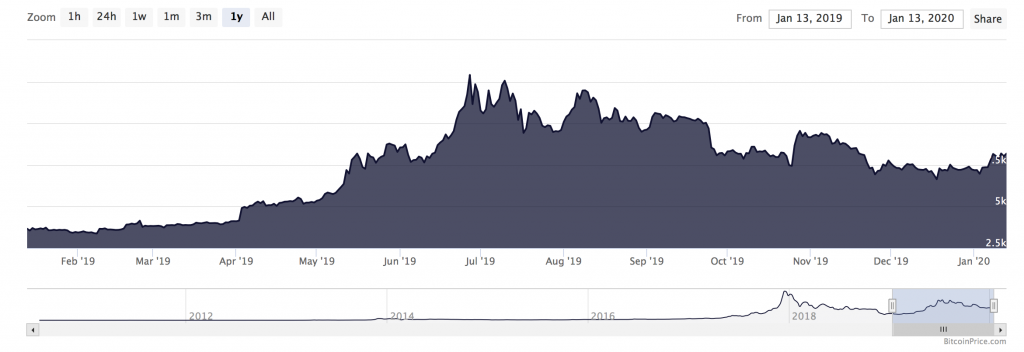
Bitcoin has broken downward-sloping trendline on the weekly chart, indicating an end of the six-month descent that began from highs near $13,800 hit in June,
1-week chart

With the invalidation of the bearish trendline, the main trend has turned bullish and the resistance at $9,203 stands exposed.
The breakout is supplemented by bullish readings on long-term indicators, as pointed out popular twitter analyst Zoinky.

Bitcoin’s weekly and monthly RSI (technical indicator) has bounced up from 50 – a sign of bullish market conditions.
The bullish setup, however, has so far failed to entice buyers. The cryptocurrency is currently priced at $8,100 – down 1% on a 24-hour basis, as per BitcoinPrice.com.
The 4-hour chart shows the bulls have failed twice in the last three days to chew through offers above $8,200 and is now eyeing the trendline support at $8,060. A move through the trendline support would create room for additional losses. On the higher side, a strong move above $8,200 is needed to revive the uptrend from lows near $7,700.
1-hour chart


