
Investment Summary
Merit Medical Systems (NASDAQ:MMSI) has begun to reprioritise capital allocation into more profitable business segments, indicating its vision for operating efficiency and product rationalisation over the coming years. Shareholders have enjoyed ~80% upside YTD, and we believe that further upward trajectory is likely based on margin targets and free cash flow guidance outlined by management in a recent investor event. However, the market may have already priced in the growth vision amidst recent strength in performance, therefore upcoming periods remain key inflection points for investors to consider in the investment debate.
Figure 1. MMSI single-year price performance
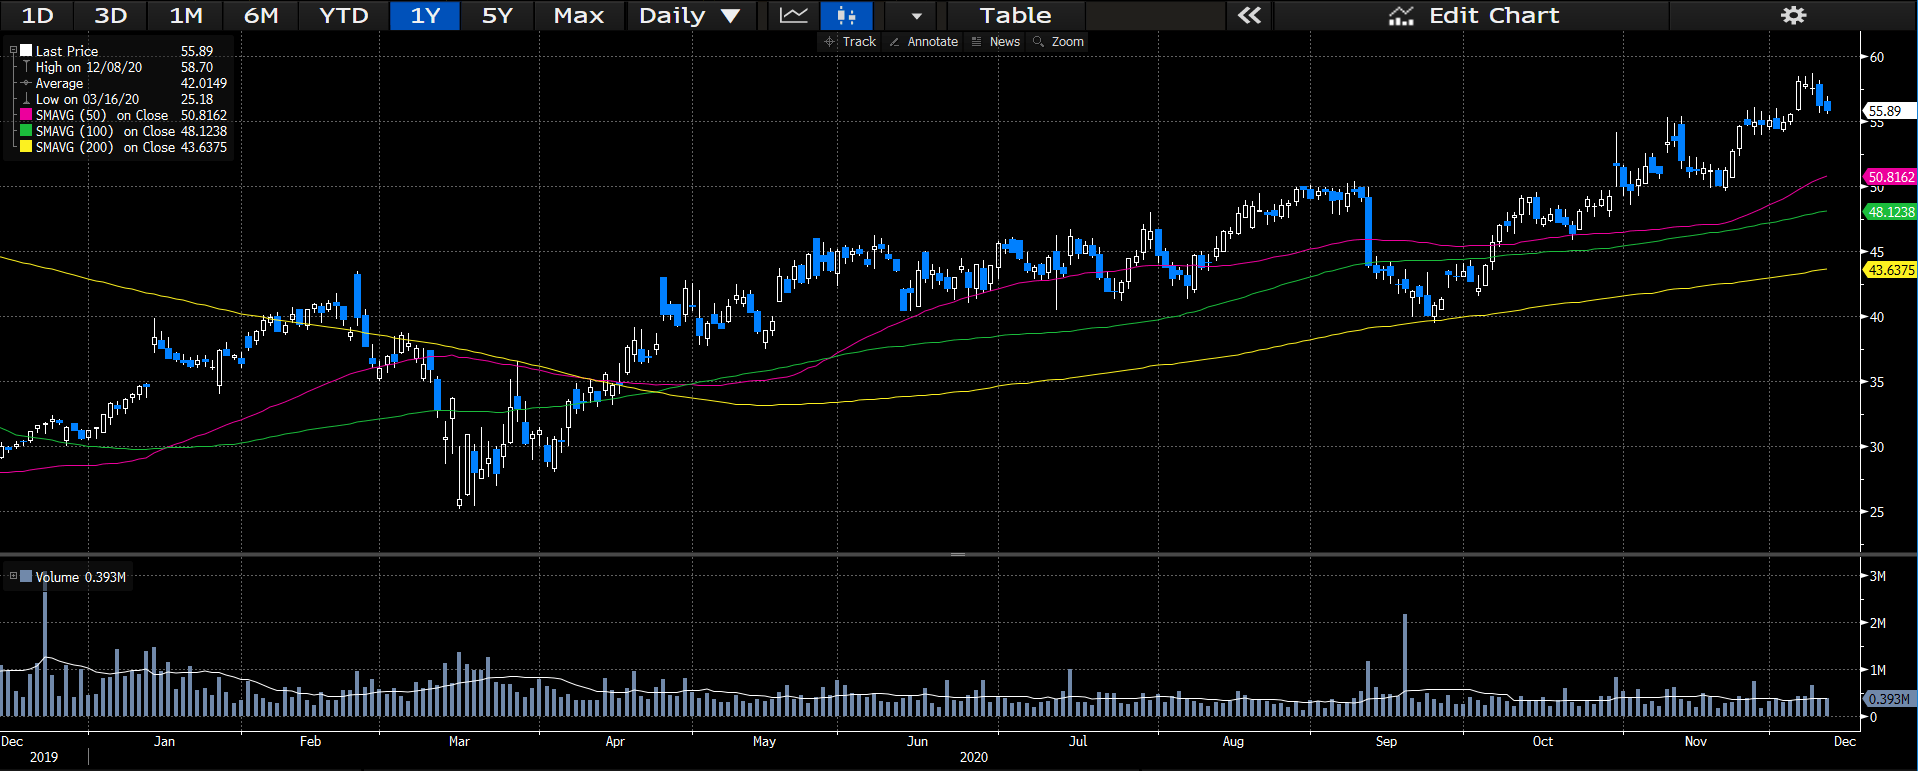
Data Source: Author’s Bloomberg Terminal
On the one hand, we have strength in a recovery from operations, upward trajectory on the charts, and reasonable margin targets outlined by management, whereas the opposite side is balanced by the fact multiples and performance are heavily tied to ROIC, which has seen challenges over the recent periods. In addition, management has caused some perplexity in analysis by modelling guidance below consensus. Therefore, we are cautiously optimistic on the outlook for MMSI shares, and here, we guide investors on the factors for consideration in the investment debate.
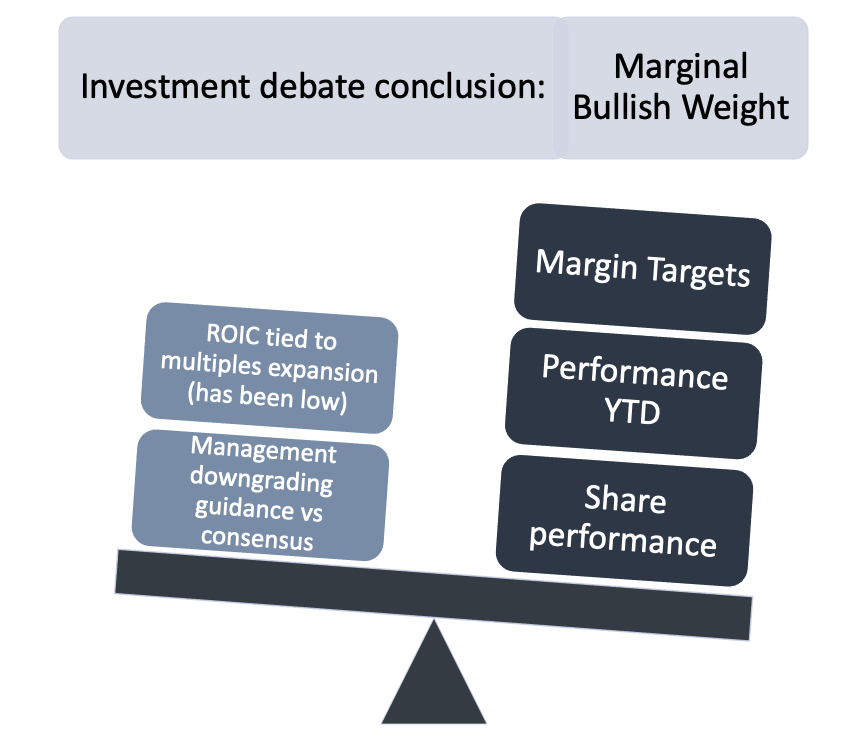
Data Source: Author
Q3 Walkthrough Highlights the Rebound
Third-quarter revenue came in above consensus at $244 million, and this was underscored by a relatively flat sequential organic growth pattern. The bolus of performance was driven by operating leverage, which saw a tailwind of ~560bps YoY to reach 15%. Strength at this level was underlined from revenue growth back near historical averages, a reduction in operating overhead and cost targeting measures implemented by management across this year. Although the company gained some leverage at this level, margins at the gross level partially offset the win here, coming in ~100bps lower YoY to reach only 47%. We would encourage investors to consider that leverage gained on operating margins may be largely offset as the pandemic diminishes, and operating overhang will likely regain in weight as production and variable costs increase on the back of sales expansion efforts.
Most of the absolute expansion at the top was driven by a sharp rebound in procedure deferrals originally caused by the pandemic. Segmentally, all areas of the portfolio came in above expectations. Cardiovascular and peripheral interventions grew 3% YoY and contributed $236 million to the top, whilst cardiac interventions within this segment saw ~7% upside YoY. Similar strength was seen in procedural solutions, which earned ~22% upside on the year, and endoscopy sales also contributed ~$8 million to the top. The crux of the rebound in all segments were all drivers to operating leverage, which benefitted on the back of the catch-up in procedure demand and may likely carry through until the end of FY2020 on the same. The company also gained ~530bps of leverage at the SG&A line which came in lower YoY at 26% of total sales. R&D spend also came in lower YoY to 5.5%, again contributing to the upside in operating margin.
Consequently, FCF conversion was able to widen over this period, expanding to $45 million from the paltry -$6.9 million in free cash one year ago. In fact, free cash conversion has been growing across the span of this year, partially driven by liquidity preservation measures undertaken by management, but also from strength in cash from operations, which came in at $55 million in Q3. As such, FCF reached the highest scores in the past five years, which was pleasing to see and signifies the value creation for shareholders that has been reflected on the charts YTD. We would also note that management compensation structuring has been adjusted to include cash flow metrics into the incentive side, which has ultimately translated to a positive outcome for shareholders. We feel this is a good use of corporate governance principles and aligns with shareholders’ interests without detracting from the focus on fiscal performance.
Accounts receivable turnover came in roughly equal at 6.7x, whilst the days of sales outstanding was lower by 2 days to 54. Inventory turnover was also flat but nonetheless strong at 2.64x, whilst accounts payable turnover increased by 2 days to 32 days. These movements resulted in a reduction to the cash conversion cycle by 4 days to 160 days, and a corresponding decrease to the inventory to cash period to 193 days. We feel that MMSI’s cash conversion cycle is a strength point in the debate, and illustrates that the company doesn’t require a large amount of cash to be tied up into working capital, whilst capitalising on decent inventory turnover amongst favourable cash generation. Although the cash conversion cycle has increased by ~10 days YoY, we would point investors to the challenges in payment terms observed in the wider market this year, with more relaxed covenants on a myriad of payment structures (to purveyors, debt facilities, interest expenses, etc.) which have likely carried through to MMSI’s situation also.
Management’s Guidance is Below Consensus
MMSI recently hosted an investor education event, titled “Foundations for Growth”, outlining long-term economics and financial guidance for the company. From our understanding, most of the sell-side had been modelling ~9-10% organic revenue growth over the coming three-year period; however, management guided a CAGR of 5%-7% over this period, which calls for ~$1.4 billion in peak sales by the end of 1H 2023. On our end (being on the buy side) we had modelled above managements guidance and saw ~8% CAGR over the coming years in the base scenario, and we were equally surprised by the language from the event. We can only assume many on the Street feeling perplexed by the same. We wouldn’t be surprised if management is being correctly cautious on several tangible headwinds that should be priced into projections over the coming periods, particularly from product rationalisation that may not have been modelled in sell-side forecasts.
The company guided a range of CAGR 4.5%-6% in US sales by 2023 and expects the EMEA segment to reach above this at CAGR 7% by the same period. Similarly, APAC is expected to grow ~6% by 2023, and the language on the peripheral intervention segment indicates it expect this portion of the portfolio to be the major performer for the US and abroad. Here it is anticipating a CAGR of ~7% with the cardiac intervention endoscopy arms to come in just below this. The product rationalisation point we raised above came from the language on the custom procedural solutions segment, which management tip to see a decline over the forecast period, by allocating additional capital to better-performing segments to realise the most upside to the portfolio. We are unsure whether management intends to cannibalise this segment to a certain extent or whether this is more of a cost targeting measure or operating efficiency measure, but could well be a combination of all three. Based on this reallocation strategy, management expects operating leverage to land in the ranges of 18%-21% by 2023, with free cash conversion in the realms of $300 million or greater at a conversion rate of 31%, based on revenue projections of $950 million to $960 million.
Adding additional flavour to the margin picture, management expects additional pressures to be lifted based on manufacturing efficiency targets, resource efficiencies, in addition to reorganising supply chain characteristics to best suit the core business strategy. From these moves, we would anticipate the company to generate additional leverage from the SG&A line that has been realised this year, in unison with the efficiency targets outlined for the core business. We would anticipate these types of measures to be realised incrementally over the coming three-year period, but we require a bit more colour on the same to advocate for key inflection points for investors to consider here. Without the exact information from management, then we would advocate that the periods surrounding earnings releases cover the basis on this point. As the company anticipates a mammoth increase in FCF by 2023, and based on the correlation in free cash movement and share direction this year, we would anticipate further free cash generation to translate towards longevity in shareholder value. Should the company deliver on its planned margin outcomes, then we certainly believe this will translate to growth at the top by 2023, especially with the planned efficiencies tied into the mix. Such performance would allow for a wider capital allocation strategy that allows for greater permeation into key end-markets.
ROIC Remains a Key Driver to Performance & Valuation
Over the past seven years, annual ROIC has remained a meaningful driver to valuation and performance. ROIC has driven at least 60% of EV/EBITDA outcomes and over 70% of P/E scores since 2013. ROIC has taken a dive over the past few years, including this year on a TTM basis, which perhaps feeds into the decision making on product rationalisation discussed in the investor event. ROIC has also driven ~52% of revenues over this period, and we feel if the company is able to up ROIC scores in the coming years, then this will convert to multiples expansion and growth at the top level. Moreover, ~48% of free cash conversion has been underscored by ROIC, although this is not necessarily statistically significant. Nonetheless, ROIC remains an integral component of MMSI’s “foundations for growth” vision, and an equally important measure that investors must consider in the ongoing investment debate. Considering the high causal relationships between ROIC and valuation in particular, then we would advocate that outcomes of the new capital allocation strategies are perhaps the most quintessential factor that investors must consider in the valuation of MMSI shares over the next few years.
Figure 2. ROIC remains a key driver to performance and valuation
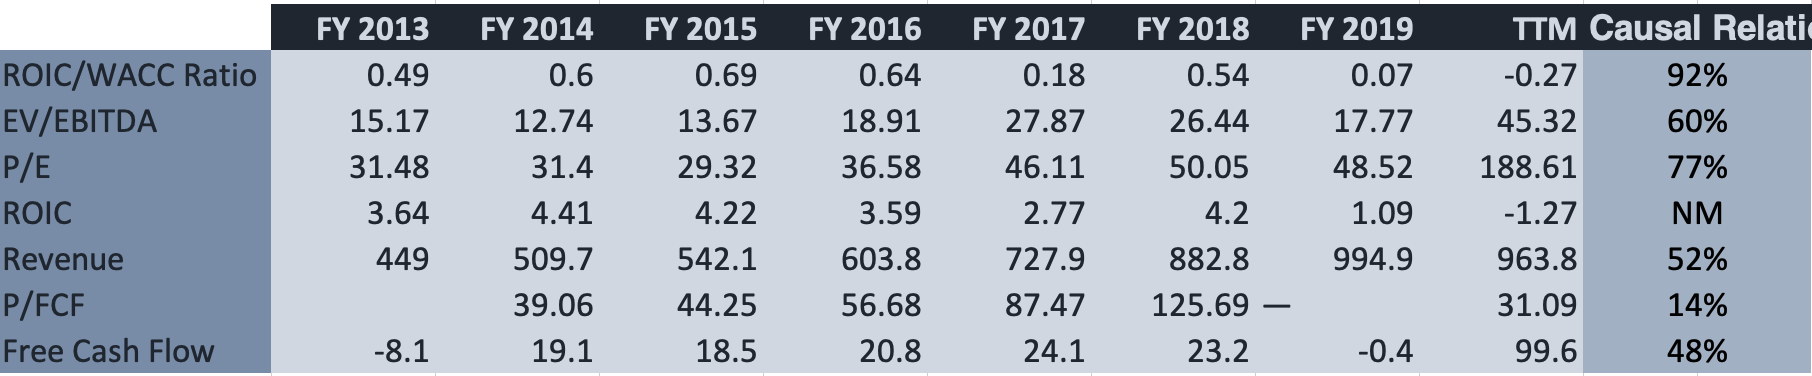
Data Source: MMSI SEC FIlings; Author’s Calculations
We can see the evidence of the above points on a simple linear regression, where the bolus of valuation outcomes remains centred at the upper and lower bounds of ROIC performance. Therefore, a key inflection point for investors to consider is MMSI’s ROIC over the coming quarters, and investors may realise multiples expansion should the company successfully deliver here. We encourage investors to keep a close eye on ROIC measures well into 2023 therefore.
Figure 3. ROIC to EV/EBITDA linear regression, 2013A – TTM
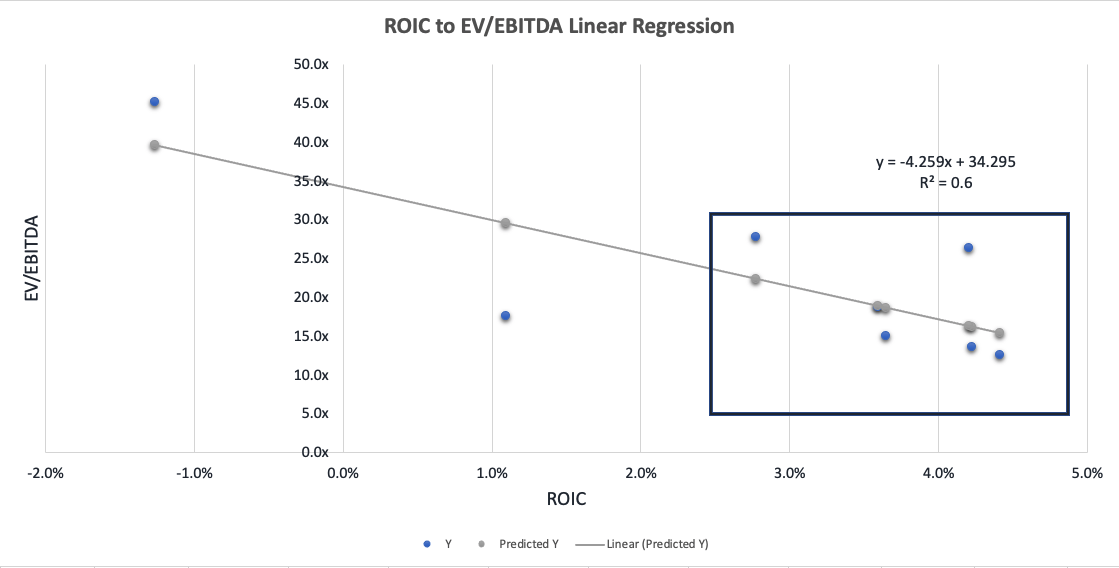
Data Source: Author’s Calculations
Figure 4. ROIC to P/E linear regression, 2013A – TTM
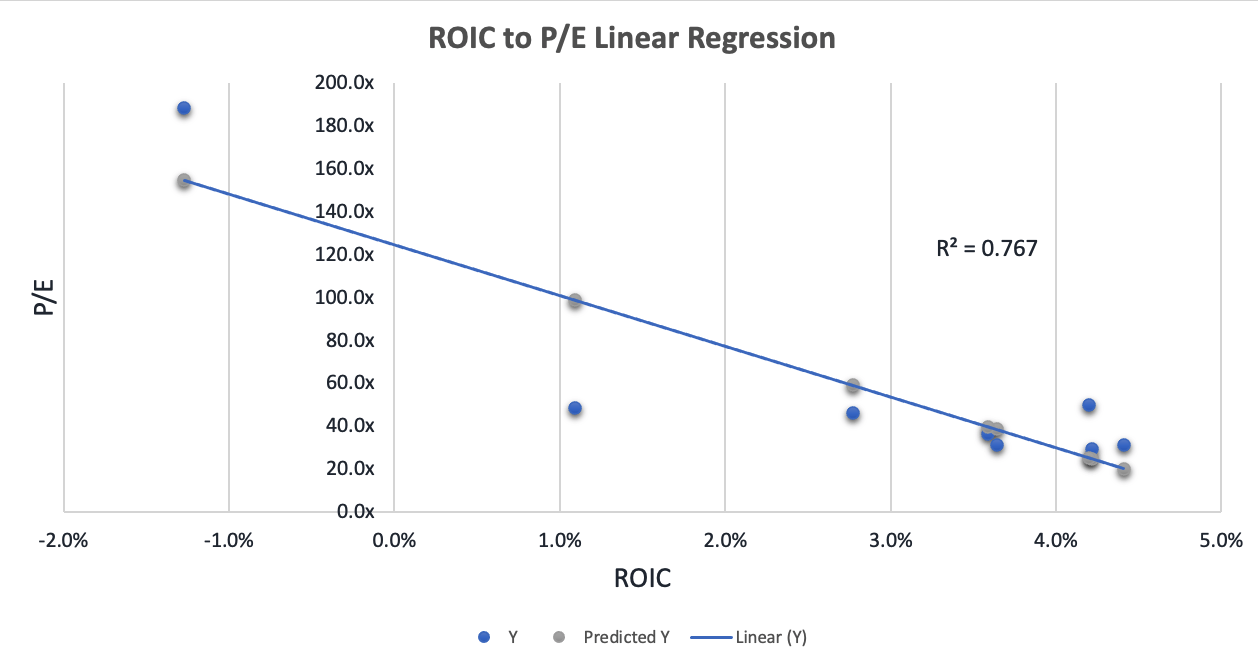
Data Source: Author’s Calculations
Valuation
Shares are trading at 31x FCF on a FCF yield of 4.13% with $0.82 in free cash per share. The company trades in line with the peer group on P/E and EV/EBITDA multiples; however, we would point to the outliers in the peer group on this examination that may skew the data set. Valuations are not necessarily unattractive at this level, but they don’t provide an overwhelming conviction for entry either, and we believe that much of the upcoming trajectory in shares may already be priced into the valuation. This is especially true given management’s commentary at the investor event, which seemed to throw many analysts (including ourselves) considering the performance of this year. However, we would point that management may be remaining correctly cautious amidst the formal restructuring and pricing in the added risk on the back of this into its own modelling.
Figure 4. Comps multiples analysis
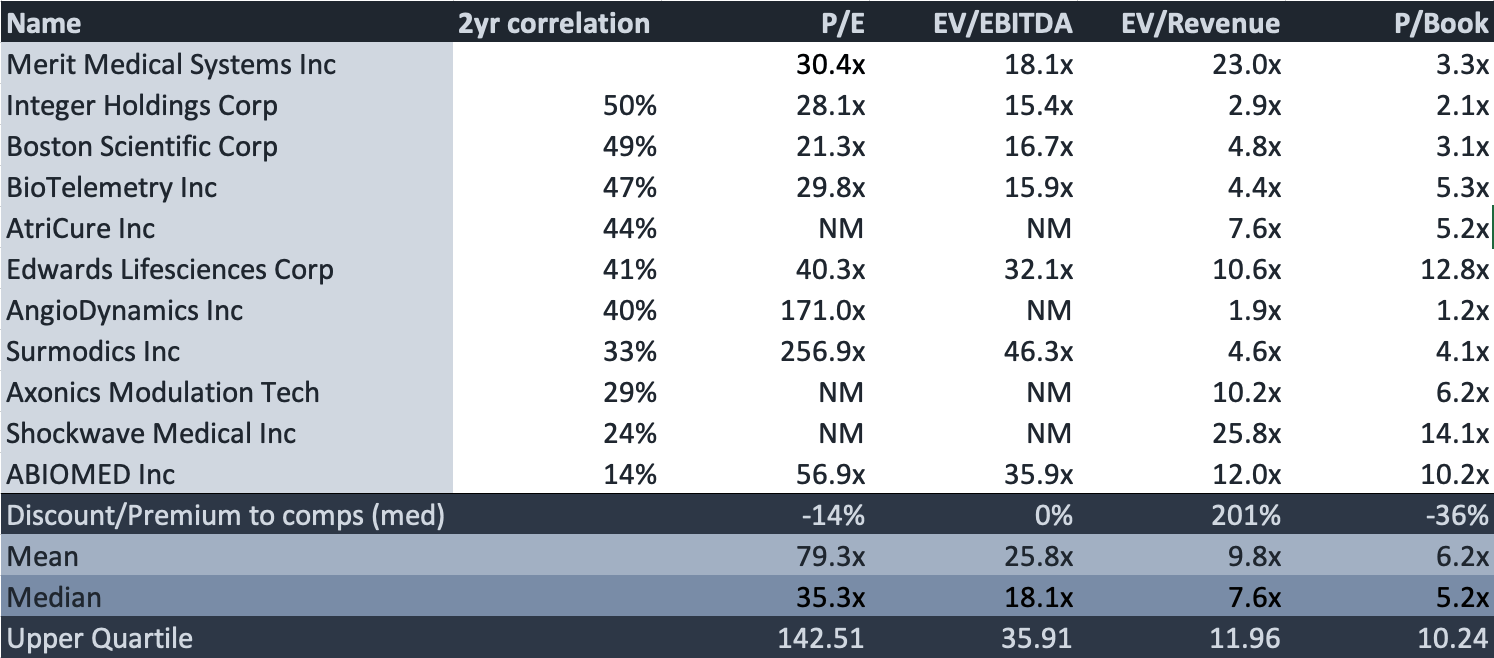
Data Source: Author’s Calculations
Given the fact shares trade largely in line with the peer median on EV/EBITDA and P/E multiples, then we’ve chosen to blend our forward estimates on the 2 with an equal weighting. Doing so, we see a blended multiple of 29x, and assigning this to our revised 2021 EPS estimates of $1.86, we see a price target of ~$54, adding to our thesis that prices may already be reflecting the upside potential in operations into current share prices (subject to change with publication times).
- Blended forward P/E & EV/EBITDA multiple – 29x
- Revised 2021 EPS estimates – $1.86
- Valuation = 29x 1.86 = $54
Using forward 35x P/E estimates alone, then we see a price target of $66, which reflects decent upside on today’s trading (subject to change with publication times).
- Forward P/E alone – 35x
- 2021 EPS estimates – $1.86
- Price Target = 35x 1.86 = 66
Therefore, taking the arithmetic mean of the blended forward multiple target and the forward P/E target alone, we see a price target of $60, ~9% upside on today’s trading.
Investors can see the potential in pricing outcomes should shares continue along the current trajectory on the chart below. We would encourage longer-term investors to familiarise themselves with the potential in pricing distribution to make decisions on entry and/or exit points over the coming quarters. Should shares continue along the current trajectory, then there is upside potential that can be realised at the points shown on the chart below. Either way, we believe that this chart should be familiar to investors in their own reasoning.
Figure 5. Potential forward pricing distribution
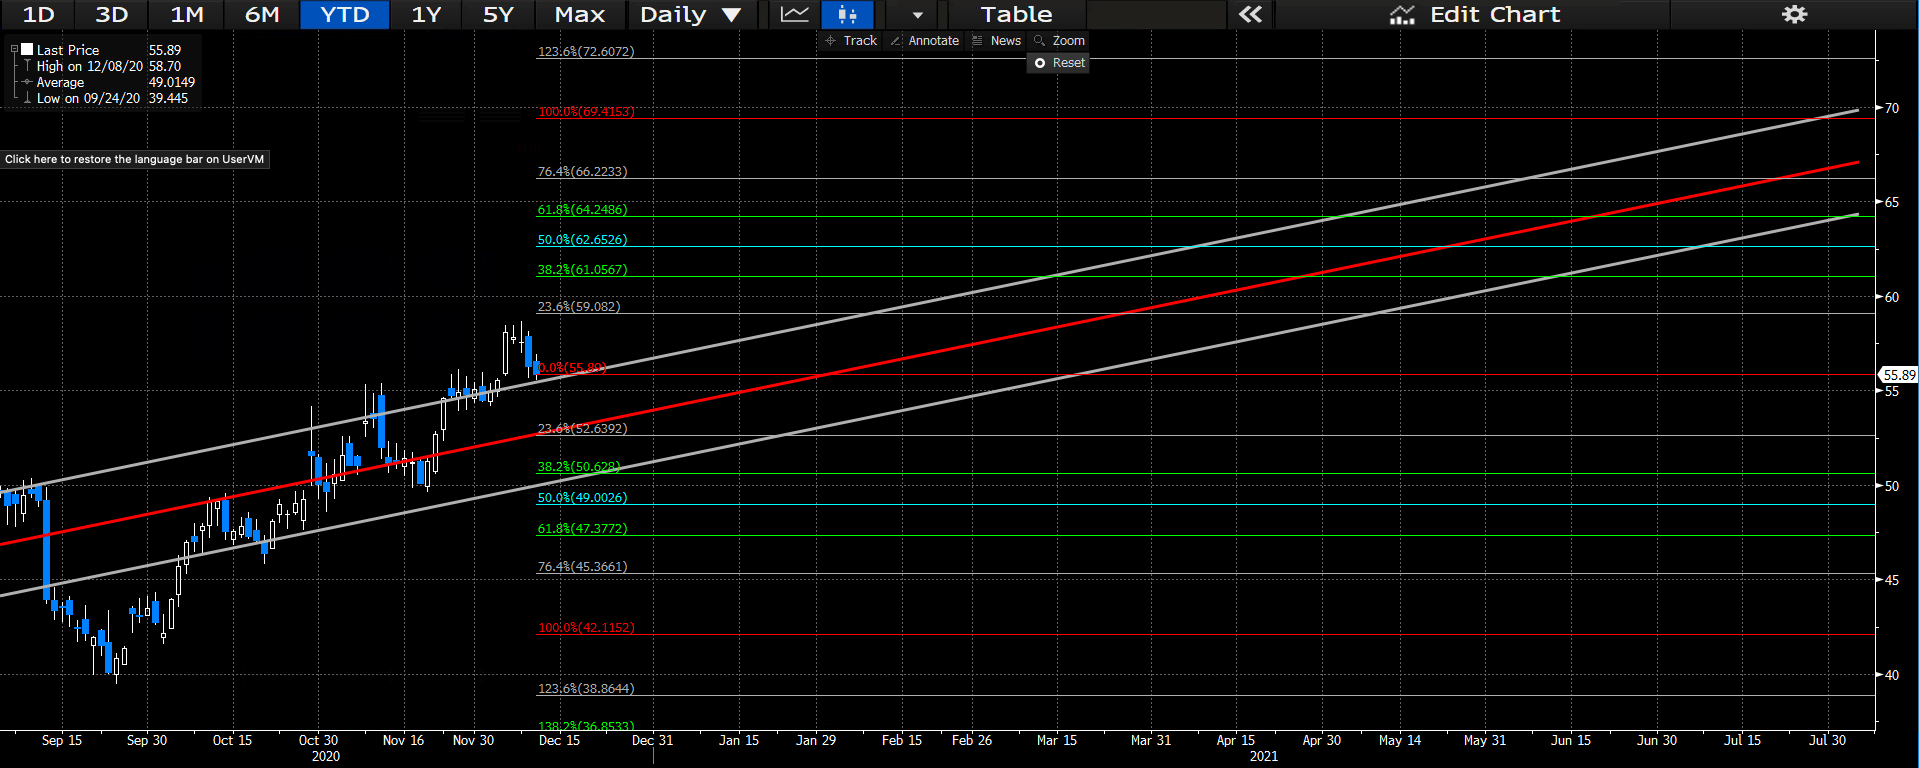
Data Source: Author’s Bloomberg Terminal
Further Considerations
On the charts, shares have made a steady climb since the selloff in March. Shares have displayed a series of mean reversion activity YTD and have reverted to the longer-term mean ~20x this year. Investors can observe the mean return figure via the red line in the regression channel on the chart below. As shares have continued in the ascending channel with low downside volatility, with the maximum drawdown occurring back in September, we believe that the current investor sentiment is bullish, and that further upside is likely on the charts. Investors can view this mean reversion activity on the chart below.
Figure 6. Pricing activity YTD
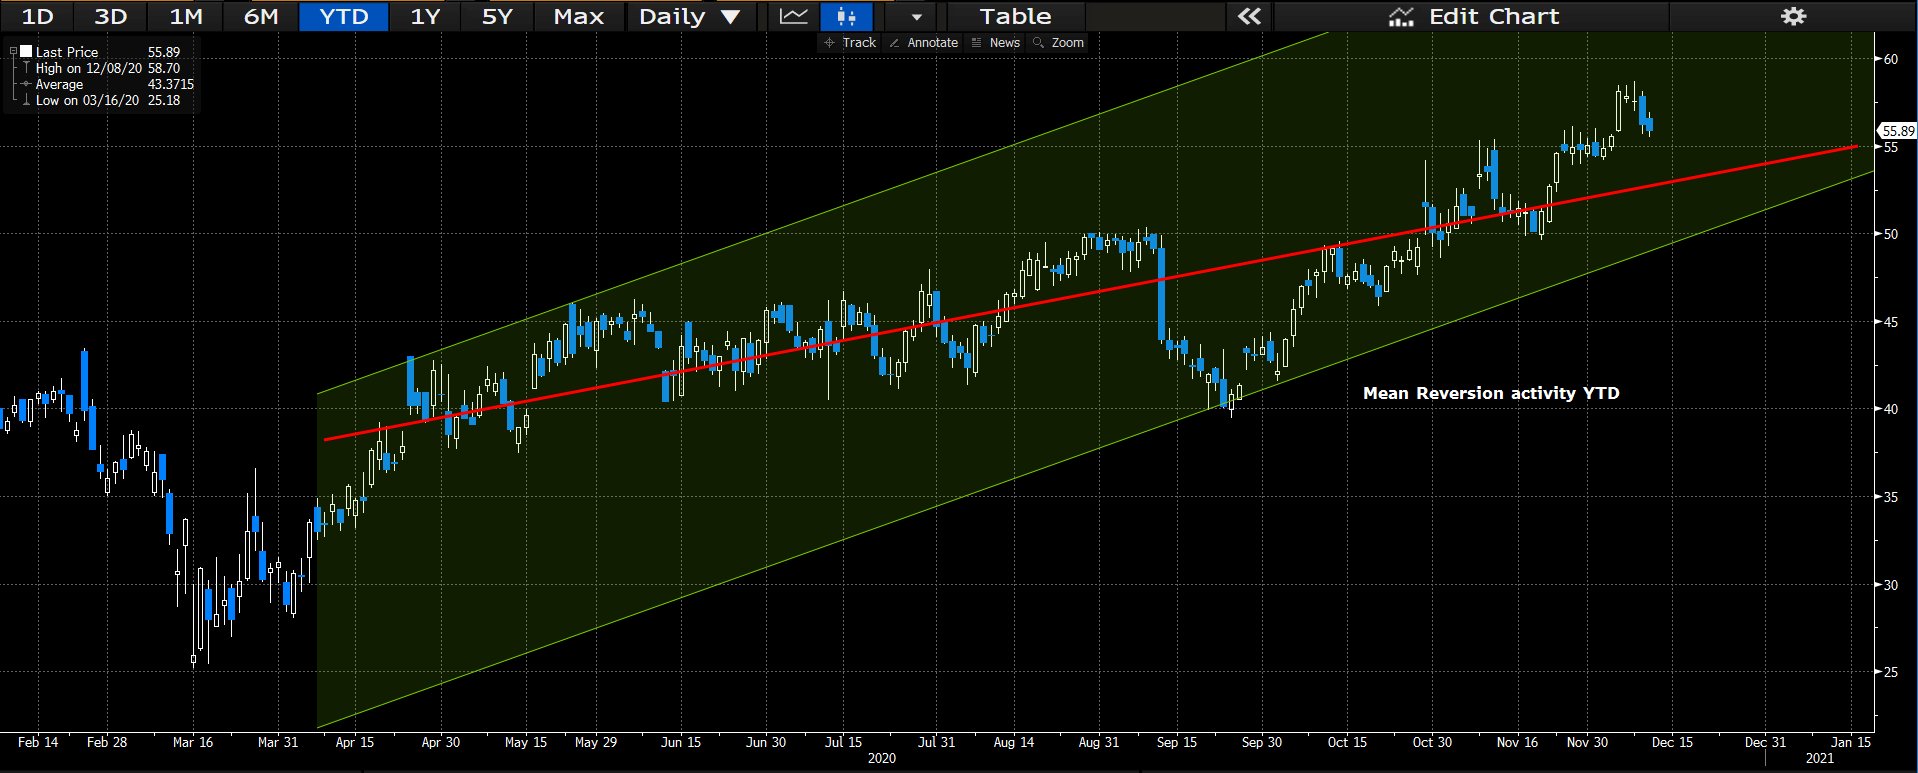
Data Source: Author’s Bloomberg Terminal
In Short
MMSI has begun its foundational growth vision and believes that increasing operating leverage and free cash conversion will be the key to driving growth and shareholder value over the coming years. We believe that management is remaining correctly cautious on the back of planned capital reallocation moves that we hope to see translate to ROIC outcomes. This is because performance and valuation multiples remain heavily tied to ROIC values, and that the new vision for sales expansion should reflect at this level in order to bolster the upside case. Furthermore, the company is trading largely in line with the group, and we would suggest that most of the future growth may already be priced into the valuation.
In addition to this, there are risks that investors must consider in the investment debate. Whilst management has pencilled in ~$300 million in free cash by 2023, there is a change that the company won’t reach this target, or the operating efficiencies planned to drive margin growth over this time period. Moreover, there is no guarantee that these moves will be reflected in share movement either. Nonetheless, we feel there is enough weight on the scale to marginally tilt the conversation to the upside, and therefore we hold a bullish outlook on the company. We would encourage investors to pay close attention to upcoming earnings periods to get insight into the return profile on capital allocation strategies outlined by management recently and to understand how this may impact multiples expansion. We look forward to providing additional coverage.
Disclosure: I/we have no positions in any stocks mentioned, and no plans to initiate any positions within the next 72 hours. I wrote this article myself, and it expresses my own opinions. I am not receiving compensation for it (other than from Seeking Alpha). I have no business relationship with any company whose stock is mentioned in this article.


