To prepare appropriate crRNAs for SENA detection, we firstly determined the amplicon sequences from several commercial rRT-PCR kits used in China and then designed specific crRNAs corresponding to each of the distinct amplicons (Supplementary Table 1a). Candidate crRNAs were prepared and analyzed individually in a SENA system, which comprised of, in addition to the crRNAs, Cas12a, FQ-reporter and the rRT-PCR products using templates of either the positive or negative controls. The apparently most appropriate crRNAs, i.e., the lowest fluorescence with the negative control and highest with the positive control, were chosen for the final formulation of the SENA assay reagents (data not shown). In general, four formulations of regents were prepared employing crRNAs against corresponding assay targets, i.e., Orf1ab (abbreviated as O), E or N genes, individually, and the mixture of O and N (abbreviated as mix).
The performance of SENA was quantitatively characterized via a systematic titration upon rRT-PCR amplicons employing pure SARS-CoV-2 RNA standards comprised of the O and N fragments, individually or mixed, as the templates. As it is aware that the viral nucleic acids extracted from patients’ samples such as nasopharyngeal swabs usually contain some biological and chemical contaminants that might inhibit the enzyme activities for reverse transcription and PCR reactions and is likely one of the causal effects attributed to the low efficiency of rRT-PCR in clinical analysis [
Pitfalls of quantitative real-time reverse-transcription polymerase chain reaction.
]. In order to mimic the clinical sampling for the titration experimentation, the RNA standards were serially diluted in buffer prepared by mixing the nucleic acid extracts from 40 COVID-19 negative people, generating RNA templates ranging from 0.025 to 25 copies per reaction (Rx).
Due to the Poisson distribution property of sampling, replica variations become extremely significant when the template copies in individual reaction are designed to be low, i.e., less than 3–4 copies/Rx, near the limit of detection (LoD) for rRT-PCR [
Modelling the limit of detection in real-time quantitative PCR.
], and extremely low, i.e., equal to and less than 1 copy/Rx. To overcome this sampling ambiguity problem, we performed 9 replicas for groups with 1 and 0.5 RNA template copies/Rx while 6 replicas for each of the rest concentrations. In addition, although the rRT-PCR assay supplier, BioGerm (BG, Shanghai, China), who follows the Chinese CDC recommended primer sets (Supplementary Table 1a), recommends 40 cycles of PCR amplification, we set 45 cycles as routine aiming at recording maximum exact Ct values if possible. After rRT-PCR reaction, all amplicons were subjected to 3 individual SENA reactions, i.e., N-SENA, O-SENA and mix-SENA with crRNAs targeting O gene, N gene and both, respectively.
Methods to determine limit of detection and limit of quantification in quantitative real-time PCR (qPCR).
], along with the decrease of the RNA templates to less than 3 copies/Rx, the rRT-PCR Ct values in some replicas, primarily that corresponding to the N gene, passed 38 (the cut-off for positive as recommended by the rRT-PCR kit suppliers) but were less than 40, which should be considered as entering the “grey zone”. The Ct values increased steadily when the concentration of the RNA templates further decreased, with more and more replicas showing one or both Ct values entering the “grey zone” and eventually all became “negative”, i.e., greater than 40 or even 45 (Fig. 2a, Supplementary Table 2 and Supplementary Fig. 1). Employing Ct=38 as the cut-off for “positive” detection, we estimated the LoD for O and N genes with 95% confidence interval (CI) of this set of rRT-PCR assay as 3.3≤4.0≤6.1 and 4.0≤4.1≤4.4, respectively (Supplementary Fig. 2). Most likely due to the influence of the complex combination of the targeted viral genomic fragments and the clinical sampling background, the LoD determined in this study was clearly higher than the published value of 2.0≤2.5≤3.7, which analyzed single target in a pure system [
Methods to determine limit of detection and limit of quantification in quantitative real-time PCR (qPCR).
].
Fig. 2Determination of the cut-off values for SENA detection (a) and the LoD values with 95% CI for both rRT-PCR (O-Ct, green dots) and SENA (mix-FCratio, black dots) (b) based on the systematic titration assays. All the experimental and analytical details are described in the text. Notice that the SENA negative cut-off was set as mix-FCratio=1.020 in this figure on the basis of the titration assay of the standard RNA templates but was adjusted to 1.068 along with the increase of the clinical applications (Figs. 1 and 4, Supplementary Table 3). LoD with 95% confidence interval was 1.2≤1.6≤2.1 with mix-SENA versus 3.3≤4.0≤6.1 with rRT-PCR.
The rRT-PCR amplicons were further analyzed by SENA detection with the measurement of the fluorescence signals for each corresponding replica. After comparison of the parameters of slope (increase of fluorescence/min) versus FC (the fold of change of fluorescence between that of the sample over that of the negative control at certain time point), we defined a parameter, FCratio, which is the ratio of the FC at 10 min to that at 5 min after the initiation of fluorescence reading (Supplementary Fig. 1 and Supplementary Table 2). We also found that in the cases with low concentrations of templates, the rRT-PCR efficiency of the two target genes (i.e., O and N) were different so as the SENA detection (Supplementary Figs. 1 and 2). In order to verify the existence of specific amplicons of SARS-CoV-2 nucleic acids in an individual rRT-PCR reaction, all of the amplicons of the replicas with RNA templates ranging from 0.125 to 2 copies/Rx were subjected to next generation sequencing (NGS) analysis. The results were found to be completely consistent with the perspective results of both O-SENA and mix-SENA. In addition, with mix-SENA, not only the signals are generally more significant than that of the O-SENA detection but also may resolve some of the ambiguity readouts found with N-SENA (Supplementary Fig. 1 and Supplementary Table 2). Based on these results, the mix-FCratio was demonstrated as the most sure-proof index for rRT-PCR confirmation, and we empirically estimated that mix-FCratio≥1.145 for positive cut-off, and mix-FCratio≤1.020 for negative cut-off (Fig. 2a). Of course, these two parameters are subject to further verification and adjustment along with the increase of tested samples. Because SENA is rRT-PCR based, the same methodology for determining the rRT-PCR LoD was used to estimate that of SENA by this set of data, corresponding to both individual O and N fragments (Supplementary Fig. 2) and in combination as indicated by the mix-SENA (Fig. 2b). As expected, the N-SENA LoD (3.7≤4.3≤4.8 with 95% CI) is very close to that of the N-Ct of rRT-PCR, while the LoD of O-SENA (1.1≤1.3≤1.7 with 95% CI) is significantly lower than that of O-Ct (Supplementary Fig. 2). Although the LoD of mix-SENA (1.2≤1.6≤2.1 with 95% CI) is slightly higher than that of O-SENA (Fig. 2b and Supplementary Fig. 2), it is apparently caused by its capable of confirming some of the ambiguous amplicons in the extremely low concentration cases (Supplementary Fig. 2) and thus, mix-FCratio is chosen for clinical applications.
3.2 Verification of SENA in different clinical scenarios
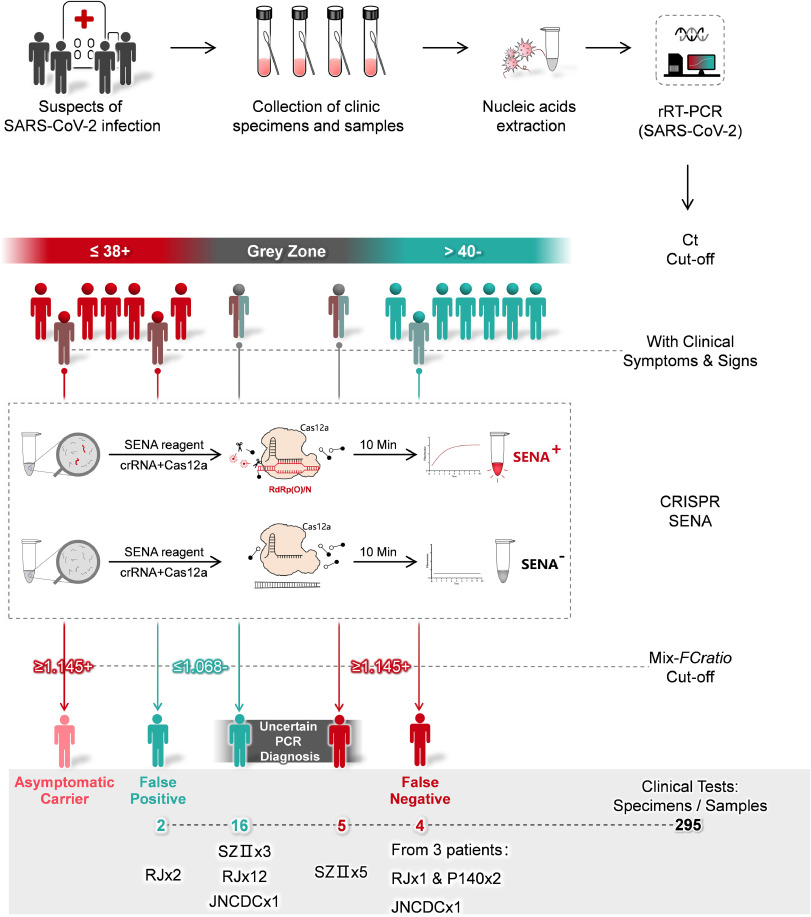
SENA was further verified in a few hospitals, testing various clinical specimens and samples under different scenarios (Fig. 1) and employing few more commercial rRT-PCR diagnosis kits in addition to BG which was used in the titration experiment (Supplementary Table 1a). Totally 295 clinical samples or specimens (mainly pharyngeal swabs) collected from 282 individuals were tested by rRT-PCR followed by SENA detection (Supplementary Table 3). Except for asymptomatic carriers, all the cases of uncertain analytic and false positive or negative readouts of rRT-PCR diagnosis were encountered and finally confirmed or corrected by SENA detection.
Specifically, samples from 139 patients of Ruijin Hospital (RJ, Shanghai, China) were assayed by rRT-PCR employing diagnostic kits of Liferiver (LR) and Beijing Genomics Institute (BGI), 137 of which had consistent readouts by all those of rRT-PCR kits, indicating two positive, 123 negative and 12 suspected that fell in the “grey zone” (Supplementary Table 3). SENA detection of these samples revealed not only the 12 suspected as negative but also identified one more positive among the original 123 negative individuals, clearly a case of false negative diagnosis (Supplementary Table 3). Besides, distinct rRT-PCR assay results, positive by BGI but negative by LR were shown for samples collected from 2 close contacts of COVID-19 patients and apparently asymptomatic (ref to Supplementary Table 3). However, the amplicons of both LR and BGI were shown as negative via SENA detection. All these ambiguous rRT-PCR amplicons (17 samples, ref to Supplementary Table 3) were finally analyzed by NGS, and the results were consistent with the SENA. Noticeably, the rRT-PCR false-negative COVID-19 patient was symptomatically mild at the point of admission with all the clinical laboratory tests negative but turned positive after 24 hours. On the other hand, although those 12 suspected patients had respiratory infection symptoms, they were finally excluded from COVID-19 according to the latest guideline for diagnosis and treatment from China National Health commission (the 6th edition). Similarly, in Shenzhen Second People’s Hospital (SZII, Shenzhen, China), 5 uncertain rRT-PCR readouts for O gene were found among 139 individuals. Three of them had Ct value of 39.47, 39.7 and 40.56, respectively but the following SENA detection gave mix-FCratio values less than 1.0 for all of them, indicating all negative. The other two individuals had Ct values of 38.87 and 39.22, while their mix-FCratio values were 1.581 and 1609, respectively, indicating positive for both. In addition, there were another three individuals with Ct values larger than 40 for O gene and 36.09, 35.88 and 37.98 for N gene, respectively; however, the following SENA detection showed mix-FCratio values were 1.39, 1.55 and 1.21, respectively, indicating all positive. All these amplicons were further confirmed by NGS analysis (Supplementary Table 3), obtaining consistent results with those of SENA. Consistently, the three SENA-negative individuals were finally excluded from SARS-CoV-2 infection after being rechecked by rRT-PCR after 24 hours (Supplementary Table 3). Based on above data, it is clear, SARS-CoV-2 infection suspects with either rRT-PCR Ct values falling in the “grey zone” or with clear patient-contact epidemiological history but negative rRT-PCR tests, are strongly recommended to perform SENA detection to minimize the possibility of misdiagnosis. On the other hand, in case an rRT-PCR-positive suspect does not demonstrate any COVID-19 clinical symptoms and/or signs, SENA detection is also strongly recommended to eliminate either false-positive diagnosis or misdiagnosis of the so-called “asymptomatic carrier” or “asymptomatic patient”.
Besides of preventing false-negative or false-positive diagnosis, the highly sensitive property of SENA may also assist in providing evidence of viral clearance for COVID-19 recovering patients. A female patient in Dongfang Hospital (DF, Shanghai, China) was confirmed as COVID-19 positive by both rRT-PCR and CT scanning and showed ground-glass opacities mixed with consolidation along the subpleural area (Fig. 3). Accordingly, the SENA test was positive with the mix-FCratio of 1.43. After the hospitalization, the patient was further analyzed by rRT-PCR at two time points, obtaining all negative results with bilateralnasal and pharyngeal swab specimens. However, the mix-FCratios of SENA for some of her specimens were 1.64, 1.36 and 1.00, respectively, indicating that the virus was contained and yet to be cleared. On the seventh day, both rRT-PCR and the corresponding SENA detection for all of her specimens were negative and these results were confirmed by NGS and consistent with her normal CT scanning results (Fig. 3). Thus, she was discharged from the hospital and safely back to home. Similar cases were found in Jinan of Shandong Province, China, where the fecal samples from two recovering COVID-19 patients were tested negative by rRT-PCR but clearly positive by SENA (Supplementary Table 3). Considering a certain percentage of the recovered patients discharged from hospitals were reported to be re-detectable positive (RP) [
Letter to the editor: three cases of re-detectable positive SARS-CoV-2 RNA in recovered COVID-19 patients with antibodies.
], the incomplete clearance of the SARS-CoV-2 virus ahead of discharge might be one of the possible causes. Therefore, it could be necessary to consider more sensitive detection approaches such as SENA as a potential index of viral clearance.
Fig. 3Schematic diagram of the hospitalization process of patient P140 (Shanghai DF Hospital). Detailed viral detection data are listed in Supplementary Table 3. Other clinical data indicated that P140 is a COVID-19 patient with mild clinical symptoms.
§Reference range for Lymphocyte count: 1.1–3.2 × 10⁹/L; Reference range for the percentage of Lymphocyte: 20–50%.
༃Label of the antibodies: +, weak; ++, medium; +++, strong.
※Label of the specimens: a, pharyngeal swab; b, nasal (left) swab; c, nasal (right) swab; d, serum; e, plasma; f, fecal.
To reconfirm and/or improve the cut-off values for SENA mix-FCratio, the ambiguous Ct values were re-estimated using the regression functions derived from the rRT-PCR assays with titrated standard RNA templates (Supplementary Figs. 4 and 5), and then the Ct values (both estimated and detected) were plotted against the corresponding mix-FCratios (Fig. 4). Combining the data from both RNA standards and clinical samples, it is clear that SENA detection is of both high sensitivity, identifying real positive samples with Ct values as high as more than 43 (approaching 50 as estimated), and high specificity, identifying real negative samples with Ct values as low as 39. Therefore, SENA can effectively eliminate uncertain diagnosis of rRT-PCR assays for SARS-CoV-2 infection. In addition, the cut-off value for SENA mix-FCratio remains unchanged as 1.145 for positive diagnosis while slightly increased to 1.068 for negative (Fig. 4), which is supposed to further increase along with the clinical applications.
Fig. 4Apparent correlation plot of the rRT-PCR Ct values against the SENA mix-FCratios in SARS-CoV-2 detection. All the data of the systematic titration experiment with low concentrations of standard RNA templates (Supplementary Table 2a) and the data of clinical tests employing samples with ambiguous rRT-PCR readouts are used in this plot. In case the Ct values are too high to be detected by the rRT-PCR assay, i.e., Ct>40~45, depending on the scenarios, the mix-FCratio-correlated “apparent Ct values” may be estimated via the template concentration-related regression functions (Methods 4.5); however, majority of the extremely high “apparent Ct values” in real negative samples are arbitrary and are adopted merely to simplify the presentation. The positive cut-off of the mix-SENA detection (mix-FCratio=1.145) is defined by the C3 and C6 samples of the systematic titration experiment (Fig. 2a), while the negative cut-off of the mix-SENA detection (mix-FCratio=1.068) is defined by the P278–1 sample of the clinical tests (Supplementary Table 3). This plot confirmed the cut-off Ct values of rRT-PCR test provided by the kit supplier (BG, ref to all detectable Ct values shown as solid dots). Meanwhile, with the aid of mix-SENA, the sensitivity of rRT-PCR was increased up to the detected level of O-Ct=43.3 in samples of D2 and D4 and estimated level of O-Ct=49.5 in samples of C6 and P280. In addition, false positives were detected with O-Ct values as low as 39 (P278–1), which was also the key test to define the negative cut-off of mix-SENA.
This website uses cookies to improve your experience. We'll assume you're ok with this, but you can opt-out if you wish. Cookie settingsACCEPT
Privacy & Cookies Policy
Privacy Overview
This website uses cookies to improve your experience while you navigate through the website. Out of these cookies, the cookies that are categorized as necessary are stored on your browser as they are essential for the working of basic functionalities of the website. We also use third-party cookies that help us analyze and understand how you use this website. These cookies will be stored in your browser only with your consent. You also have the option to opt-out of these cookies. But opting out of some of these cookies may have an effect on your browsing experience.
Necessary cookies are absolutely essential for the website to function properly. This category only includes cookies that ensures basic functionalities and security features of the website. These cookies do not store any personal information.
Any cookies that may not be particularly necessary for the website to function and is used specifically to collect user personal data via analytics, ads, other embedded contents are termed as non-necessary cookies. It is mandatory to procure user consent prior to running these cookies on your website.


