
Judging from some of the NMS II comment letters, many in the industry would like data to be complimentary, as in completely free of charge.
But one comment in the file proposes (Note 14) that exchange data is a “complementary” product. That’s a completely different argument.
How does the complementary theory work?
The economic definition of complementary products is that once you buy one product, you must buy another. Think a video game and the gaming console, or a smartphone and a smartphone charger. That means removing customer choice and price elasticity.
The comment letter debates that this concept should work for direct-feed market data too. Sadly, this argument lacks actual data. That’s a shame, because we can test this theory with data.
If the complementary product theory was applicable to market data, all exchanges would be free (pun intended) to charge whatever they want for data, with no relationship to underlying data value (or even quantity). In addition, all customers would be buying all direct feeds, with no substitutes or substitution.
The data shows the opposite. Prices of direct feeds fall as their value falls, and even then, some customers opt out of specific feeds.
In fact, many smaller exchanges can’t even give their (free) data away, although that may all change with the SEC’s new NMS II proposals. The expansion of core data would effectively guarantee depth income even for smaller exchanges, who would also be given more votes on the governing committee. That, in turn, will likely subsidize non-marketable quotes in those markets and lead to additional fragmentation and message traffic.
How much value do additional prices have?
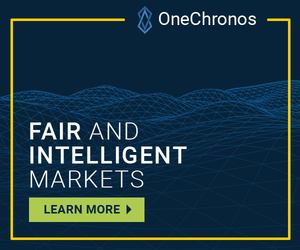
The SIP formula allocates revenues roughly in line with contribution to market quality, with a skew that mathematically favors smaller stocks, where it is harder to encourage liquidity and tight spreads. In a recent study, we computed the additional value added by new exchanges quotes, gauging how often they actually improved spreads.
Both approaches rank venues in roughly the same order and scale (the venues in Chart 1 sit close to a diagonal).
Chart 1: Incremental value added to NBBO vs. SIP quote revenues (Nasdaq listings)
This provides a useful yardstick for us to now look at the competitiveness (or fairness) of direct feed pricing.
Direct feeds are not all equal
Exchange rate sheets are public and regulated, providing a lot of transparency into the prices for prop-data feeds. In fact, if an ATS were to purchase all direct feeds, which is not usually the case, we estimate that a typical Alternative Trading System (ATS) might pay:
- $1.16 million per year to buy direct feeds from all exchanges.
- $144,000 per year to buy SIP data for all tickers.
That is a much higher fixed price than what individuals pay for SIP data, but it reflects the fact that many ATSs trade millions of shares every day. It would not be fair for each retail investor to pay the same fees as a large broker with hundreds of clients.
We compiled this data by first looking at the public exchange rate sheets and modeled costs for an Alternative Trading Systems (ATS) using approximately 40 servers. We then added direct access and non-display fees for each exchange. If any ATS operators want to send us their data on this, we will gladly update our findings.
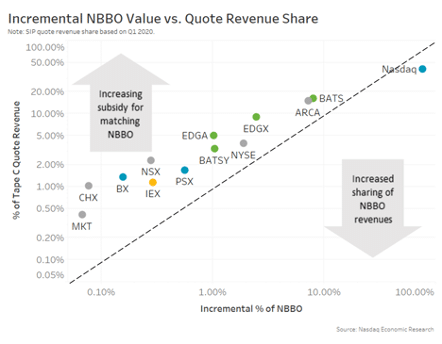
Chart 2: Evidence of elastic prices: exchanges with less data charge lower rates
Those direct feed prices also vary by exchange, and even within exchange groups. Comparing the breakdown of direct feed prices to the SIP revenue breakdown shows that prices fall as the value of the data falls (the venues in Chart 2 also sit close to a diagonal).
That seems to confirm that direct feed prices have price elasticities.
Brokers have choices and many don’t buy all the direct feeds
Data on direct feed usage and purchase patterns is far less transparent. However the new Form ATS-Ns, which show what dark pools do, is useful.
That data shows that, far from “everyone needing all direct feeds:”
- In fact, 45% of ATSs do not buy any direct feeds; instead, they use the SIP.
- The 18% of ATSs who buy some direct feeds actually opt out of others, showing that the SIP is often a substitute for direct feeds.
- Prices fall as the value of data falls (diagonal line). Despite that, some ATSs frequently opt out of some of the less expensive exchanges. That seems to show that price elasticity exists. The fact that sometimes free data is opted out of also seems to highlight fixed costs of fragmentation, forcing all customers to connect to all new venues direct feeds, is missing from this debate.
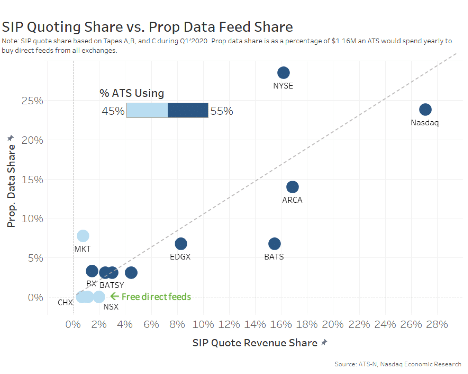
Chart 3: Not all ATSs take direct feeds; smaller ATSs with less revenue tend to be more selective about what they purchase

Are direct feed costs excessive?
Although this only shows the behavior of approximately 30 dark pools, it represents the largest and most sophisticated brokers.
We have shown that the other 99% of the market is not affected by the latency differences between SIP and direct feeds, so don’t need direct feeds. Despite this, it is less clear whether the other 99% will still incur some of the costsof the SEC’s new data proposals.
But data costs are only half of this competition equation.
So what do ATSs earn?
Public data on what dark pools charge for trading is included in the ATS-N data. Unlike exchanges, which have explicit rate sheets and tiers, dark pools report a range of costs that includes “free” to some customers to well over 10 mils on most venues. Clearly, dark pools cost more than nothing to run, but how to account for “costs,” especially when you have a platform that bundles customer services, is a topic for another day.
Instead, let’s consider that internalizing flow helps help brokers keep more commissions, average all-in-costs on exchange are between five mils and seven mils. We also know that IEX, one of the main competitors to ATSs, charges nine mils for its hidden orders. In the absence of better data, we use 10 mils per side to estimate “virtual” revenues of dark pools (height of bars in Chart 3).
That shows that 20 ATSs—adding to more than 94% of all dark pool trading—have (virtual) revenues of greater than $10 million per year. That’s almost 10 times the costs of buying direct feeds from all exchanges.
We can also estimate gross margins based on data costs and revenue estimates (red diamond and right axis). Although this ignores hardware and software development costs, based on this accounting, gross margins on almost all appear to be positive. Chart 3 also shows how substituting the SIP data (green bars) helps smaller ATSs retain positive margins.
Not everyone is buying every feed
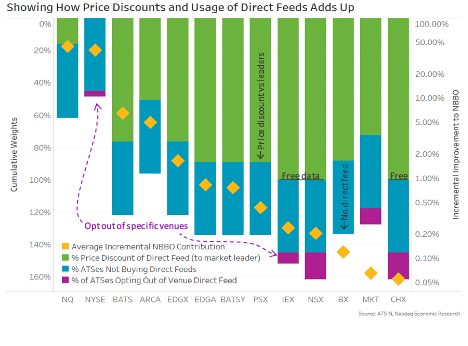
Looking at the data on direct feeds, we show in Chart 4 that:
- Exchanges charge less for less valuable data, supporting price elasticity (Exchanges are ranked by contribution to market quality, and the data discount versus the market leader is shown in green. The discount is generally larger as you move to the right).
- The majority of dark pools don’t buy all direct feeds anyway, proving substitution occurs (blue bars show 45% of all ATSs use the SIP).
- Some traders opt out of specific direct feeds on a venue-by-venue basis (purple bars).
- Some don’t even take free data, highlighting missing fixed costs of fragmentation (purple bars with free data).
That seems to fail most of the tests for data being a complementary product.
Chart 4: Comparing direct feed prices and usage vs. contribution to NBBO quality
We get it. The industry would prefer market data was completely free. But that’s not fair either.
In the meantime, data shows that customers exercise choices that force smaller exchanges to charge less for their data. Even then, sophisticated brokers often decide it’s not worth paying for.
We can debate whether brokers should keep more of their commissions, or pay less to exchanges for their prices their ATS’s use. However, based on the available information, the complementary product theory for market data does not withstand data-driven scrutiny.


