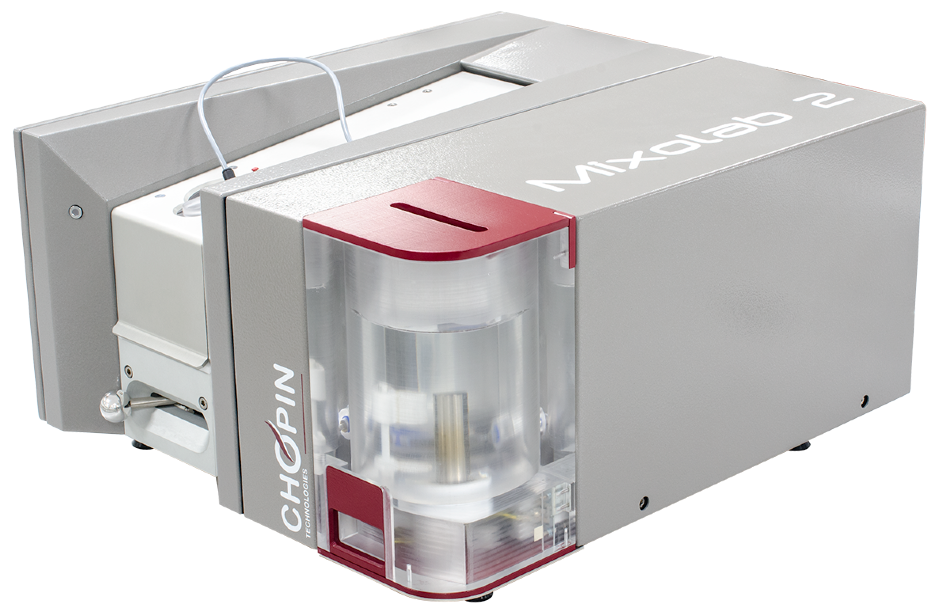
Developed by CHOPIN Technologies, the Mixolab 2 is a laboratory device which is utilized to characterize the rheological behavior of dough subjected to a dual mixing and temperature constraint.
In one single test, the Mixolab can provide full information about cereal flour quality (both starch and protein parts). It is possible to predict final product qualities from flour or whole wheat meal samples thanks to Mixolab data.

In a novel experirment, a customer would like to assess Mixolab’s ability to predict and characterize the quality parameters of commercial samples for the tortilla.
- Reference: Method AACC 54-60.01: Determination of rheological behavior as a function of mixing and temperature increase in wheat flour and whole wheat meal
- Objective: The aim of this study is to develop formulas to predict with Mixolab, from flour rheological behavior, the reliability, and diameter of tortillas
- Constraints: To develop robust prediction models the sample number stays low (a minimum of 100 samples is normally required), the validation step is not possible. Uncertainty or repeatability limits of rollability and diameter determination were not supplied.
Methods and Materials
Mixolab was used to analyze 58 flour samples (Chopin + protocol using a constant consistency 1,1 Nm) and were employed in the tortilla industrial process. Diameter and rollability and measurements (tortillas quality parameters) were also established (Reference method).
All these analyses (Mixolab and reference technique) have been performed by an approved a 3rd party. Data analysis and statistical treatments have been performed using the CHOPIN Technologies Applications laboratory standard protocols.
Reference Method
The quality rating is based on the following:
Table 1. Tortilla quality criteria. Source: CHOPIN Technologies

NB: As rollability is a judge on 2 levels, to facilitate data treatment, the diameter is also analyzed with 2 levels, good and fair on one side and poor on the other side.
Predicting Method
Torques time (T1 to T5), amplitude, stability, temperatures of dough for each torque (T °C1 to T °C5), smoothed torques (CL1 to CL45), characteristic torques (C1, C2, C3, and C5), and absorbed energy (PA1 to PA45) values have been extracted from the Mixolab curve.
Thanks to statistical Minitab software, all the data was employed to establish multiple linear regression formulas. Two graphic representations were utilized to show the results:
- The first one is the correlation between the estimation calculated by the mathematical model and the bake making values.
- The second is the percentage of accurately predicted samples according to the ‘accepted error’. The ‘accepted error’ is the maximum accepted difference between bake making and predicted values. This ‘accepted error’ is shown in the percentage of the predicted value (see calculation example in Annex 1, Graph A1-4)
The model performance is also determined by class. That means if the model properly predicted sample quality (good and fair or poor quality).
NB: With 58 samples, it is possible to develop prediction models but not to validate the performance, thanks to new samples.
Results – Rollability
The rollability results are satisfactory, 77,5% of the samples are accurately predicted, into correct classes. There are around 20% of chances that the model does not predict the rollability properly and this 20% are regarding only the value between 2,8 and 4. (The sample is very near to the limit value 3 – Graph 1).

Graph 1&2: Correlation between the rollability reference value and the predicted value. The red line represents the limit between poor and good quality. The green rectangles represent the extreme values and the purple rectangles represent the middle values.
As seen in Graph 2, the extreme values (very good quality or very poor) are systematically accurately predicted. 50% of the samples were predicted properly, with an accepted error equal to 10%, as seen in Graph 3.

Graph 3: Percentage of accurately predicted samples according to the “accepted error”.
If an error of 20% is accepted, then 80% of the samples were predicted properly. For instance, with a rollability estimated to 3, the probability that “true” value is included between 2,4 and 3,6 is equal to 80%.
Table 2. Synthesis of rollability prediction results. Source: CHOPIN Technologies

Results – Diameter
The diameter parameter shows very satisfactory results, of the samples, 77,5% are predicted properly into correct classes. There are around 20% of the samples that the model does not properly predict the diameter, and this 20% are only concerning the value between 150 and 160. The sample is very near to the limit value of 157, as seen in Graph 4.
As seen in Graph 5, the extreme values (very good quality or very poor) are systematically accurately predicted.

Graph 4&5: Correlation between the diameter reference value and the predicted value. The red line represents the limit between poor and good quality. The green rectangles represent the extreme values and the purple rectangles represent the middle values.
Graph 6 shows that, with an accepted error equal to 10%, 95% of the samples were predicted properly. For instance, with a diameter estimated to 150 mm, the probability that “true” value is included between 135 and 165 is 98%.

Graph 6: Percentage of accurately predicted samples according to the “accepted error”.
Table 3. Synthesis of diameter prediction results.

Conclusions
For diameter and rollability parameter predictions, determining the quality of tortilla flour is possible with the Mixolab. This study was peformed with a good range of values but with a small number of samples.
Yet, a validation phase with new samples will be needed to finalize the method for implementation. To determine real model performances it is also necessary to know the uncertainty of the reference method, which was not done in this experiment. This first study exhibits that the Mixolab is a pertinent device to characterize tortilla flours and identify the poor and good samples and is an appropriate tool for quality control.
Appendix
The percentage of accurately predicted samples according to the ‘accepted error’ is calculated to evaluate prediction model performances. ‘Accepted error’ corresponds to the maximum difference that is accepted between the reference value and predicted value. This ‘accepted error’ is expressed in a percentage of the predicted value.

Graph A1-4: Model performances evaluation – % of accurately predicted samples according to the ‘ accepted error’.
With an error equal to X%. The probability that the difference between predicted value (Vpredicted) and reference value (Vreference) is lower than X% of predicted value ((Vpredicted*X)/100) is equal to Y%.
With a Relative volume estimated to 100. Probability that ‘’true’’ value is included between 90 and 110 (Vpredicted +/ – 10%) is equal to 70% (Figure A1-4).
In the same way, the accepted error that permits to predict accurately 90% of samples is equal to 20% (Figure A1 -4).
Table 4.


Graph A2-1: Set distribution.


Graph A2-2: Set distribution.

This information has been sourced, reviewed and adapted from materials provided by CHOPIN Technologies.
For more information on this source, please visit CHOPIN Technologies.


