
Editor’s note: This article was originally published on July 15, 2020, by Menzie Chinn here.
Industrial production numbers are out today. Here are five key indicators referenced by the NBER’s Business Cycle Dating Committee.
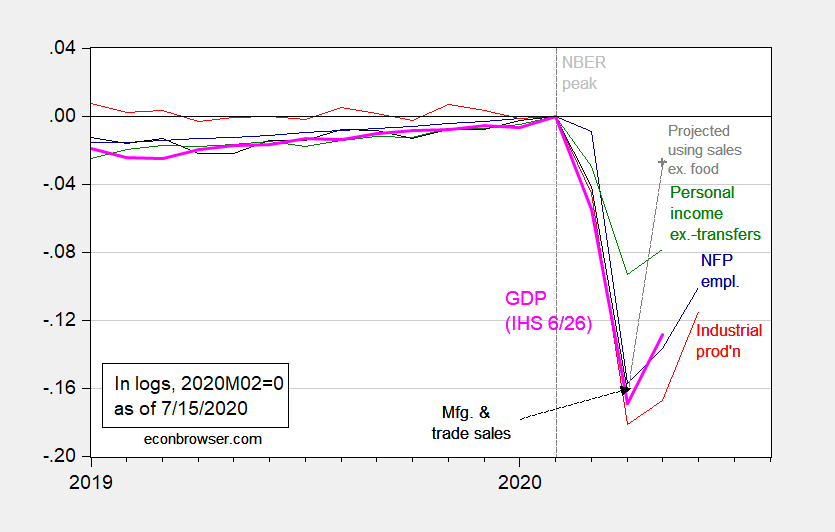
Figure 1: Nonfarm payroll employment (blue), industrial production (red), personal income excluding transfers in Ch.2012$ (green), manufacturing and trade sales in Ch.2012$ (black), and monthly GDP in Ch.2012$ (pink), all log normalized to 2019M02=0. May observation for manufacturing and trade sales projected using log-linear regression of sales on retail sales ex.-food services over the 2019-20M04 period. Source: BLS, Federal Reserve, BEA, via FRED, Macroeconomic Advisers (6/26 release), NBER, and author’s calculations.
If one were convinced that these indicators (along with many others) were going to continue to trend upwards, one could imagine a recession declared as starting in 2020M02 (NBER peak) and ending in 2020M04 (trough). However, if there were to be a relapse in some of the indicators in July-August (see discussion here), one could imagine a longer contraction eventually being declared (some accounts say there’s an increasing view in the Fed along these lines).
Editor’s Note: The summary bullets for this article were chosen by Seeking Alpha editors.


