Key Highlights:
- Kyber has increased by over 146% over the past 30-days of trading.
- The cryptocurrency rose by a further 14% today to reach a high of $0.85.
- Kyber Network is now quickly climbing the cryptocurrency rankings as it currently holds a $72.28 million market cap value which puts it in the 58th position.
| ⠀Kyber Network price: | $0.87 |
|---|---|
| ⠀Key KNC resistance levels: | $0.878, $0.90, $0.942, $1.00, $1.03 |
| ⠀Key KNC support levels: | $0.80, $0.77, $0.70, $0.625, $0.60 |
*Price at the time of writing
The Kyber Network token has been on an absolute rampage over the recent weeks after it increased by over 146% this past month. The cryptocurrency is now on the road to create fresh highs for 2020 as it looks to break above the $0.90 and head toward $1.00 for the first time since July 2018.
The Kyber Network itself has seen some great announcements being made over the past month with the first being the fact that they were to be listed on Coinbase Pro. Once it was officially listed, Kyber Network started to surge at an aggressive pace as it increased by over 110% in a small 4-day period.
Another great announcement was the fact that they are planning on upgrading to Katalyst at some point during Q2 2020 which will bring a variety of performance enhancements to the network and should help to align the incentives for all the network participants. It will bring a variety of new features which include staking. However, one of the most exciting features is the fact that KyberDAO will be released which will allow the users of the community to have a strong say in the future direction for Kyber Network.
Amongst all of this high-profile news, Kyber has actually managed to facilitate over 100,000 trades in 2020 alone! In fact, in February 2020, it managed to facilitate over $138 million in just one single month!
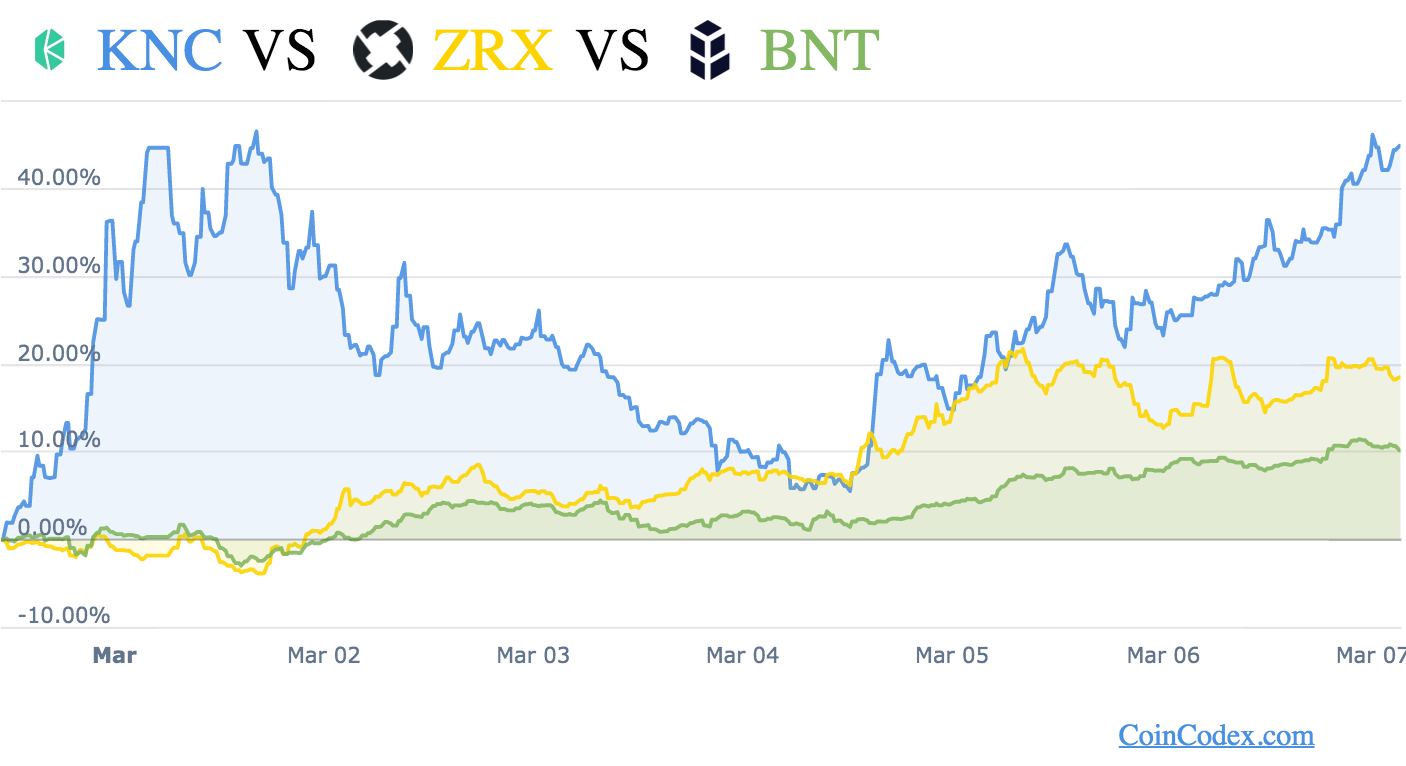
This strong growth is clearly causing Kyber to pull away from its competition. The following chart represents how quickly KNC is pulling away from other decentralized DeFi exchange protocol solutions;
KNC Price Analysis
What has been going on?
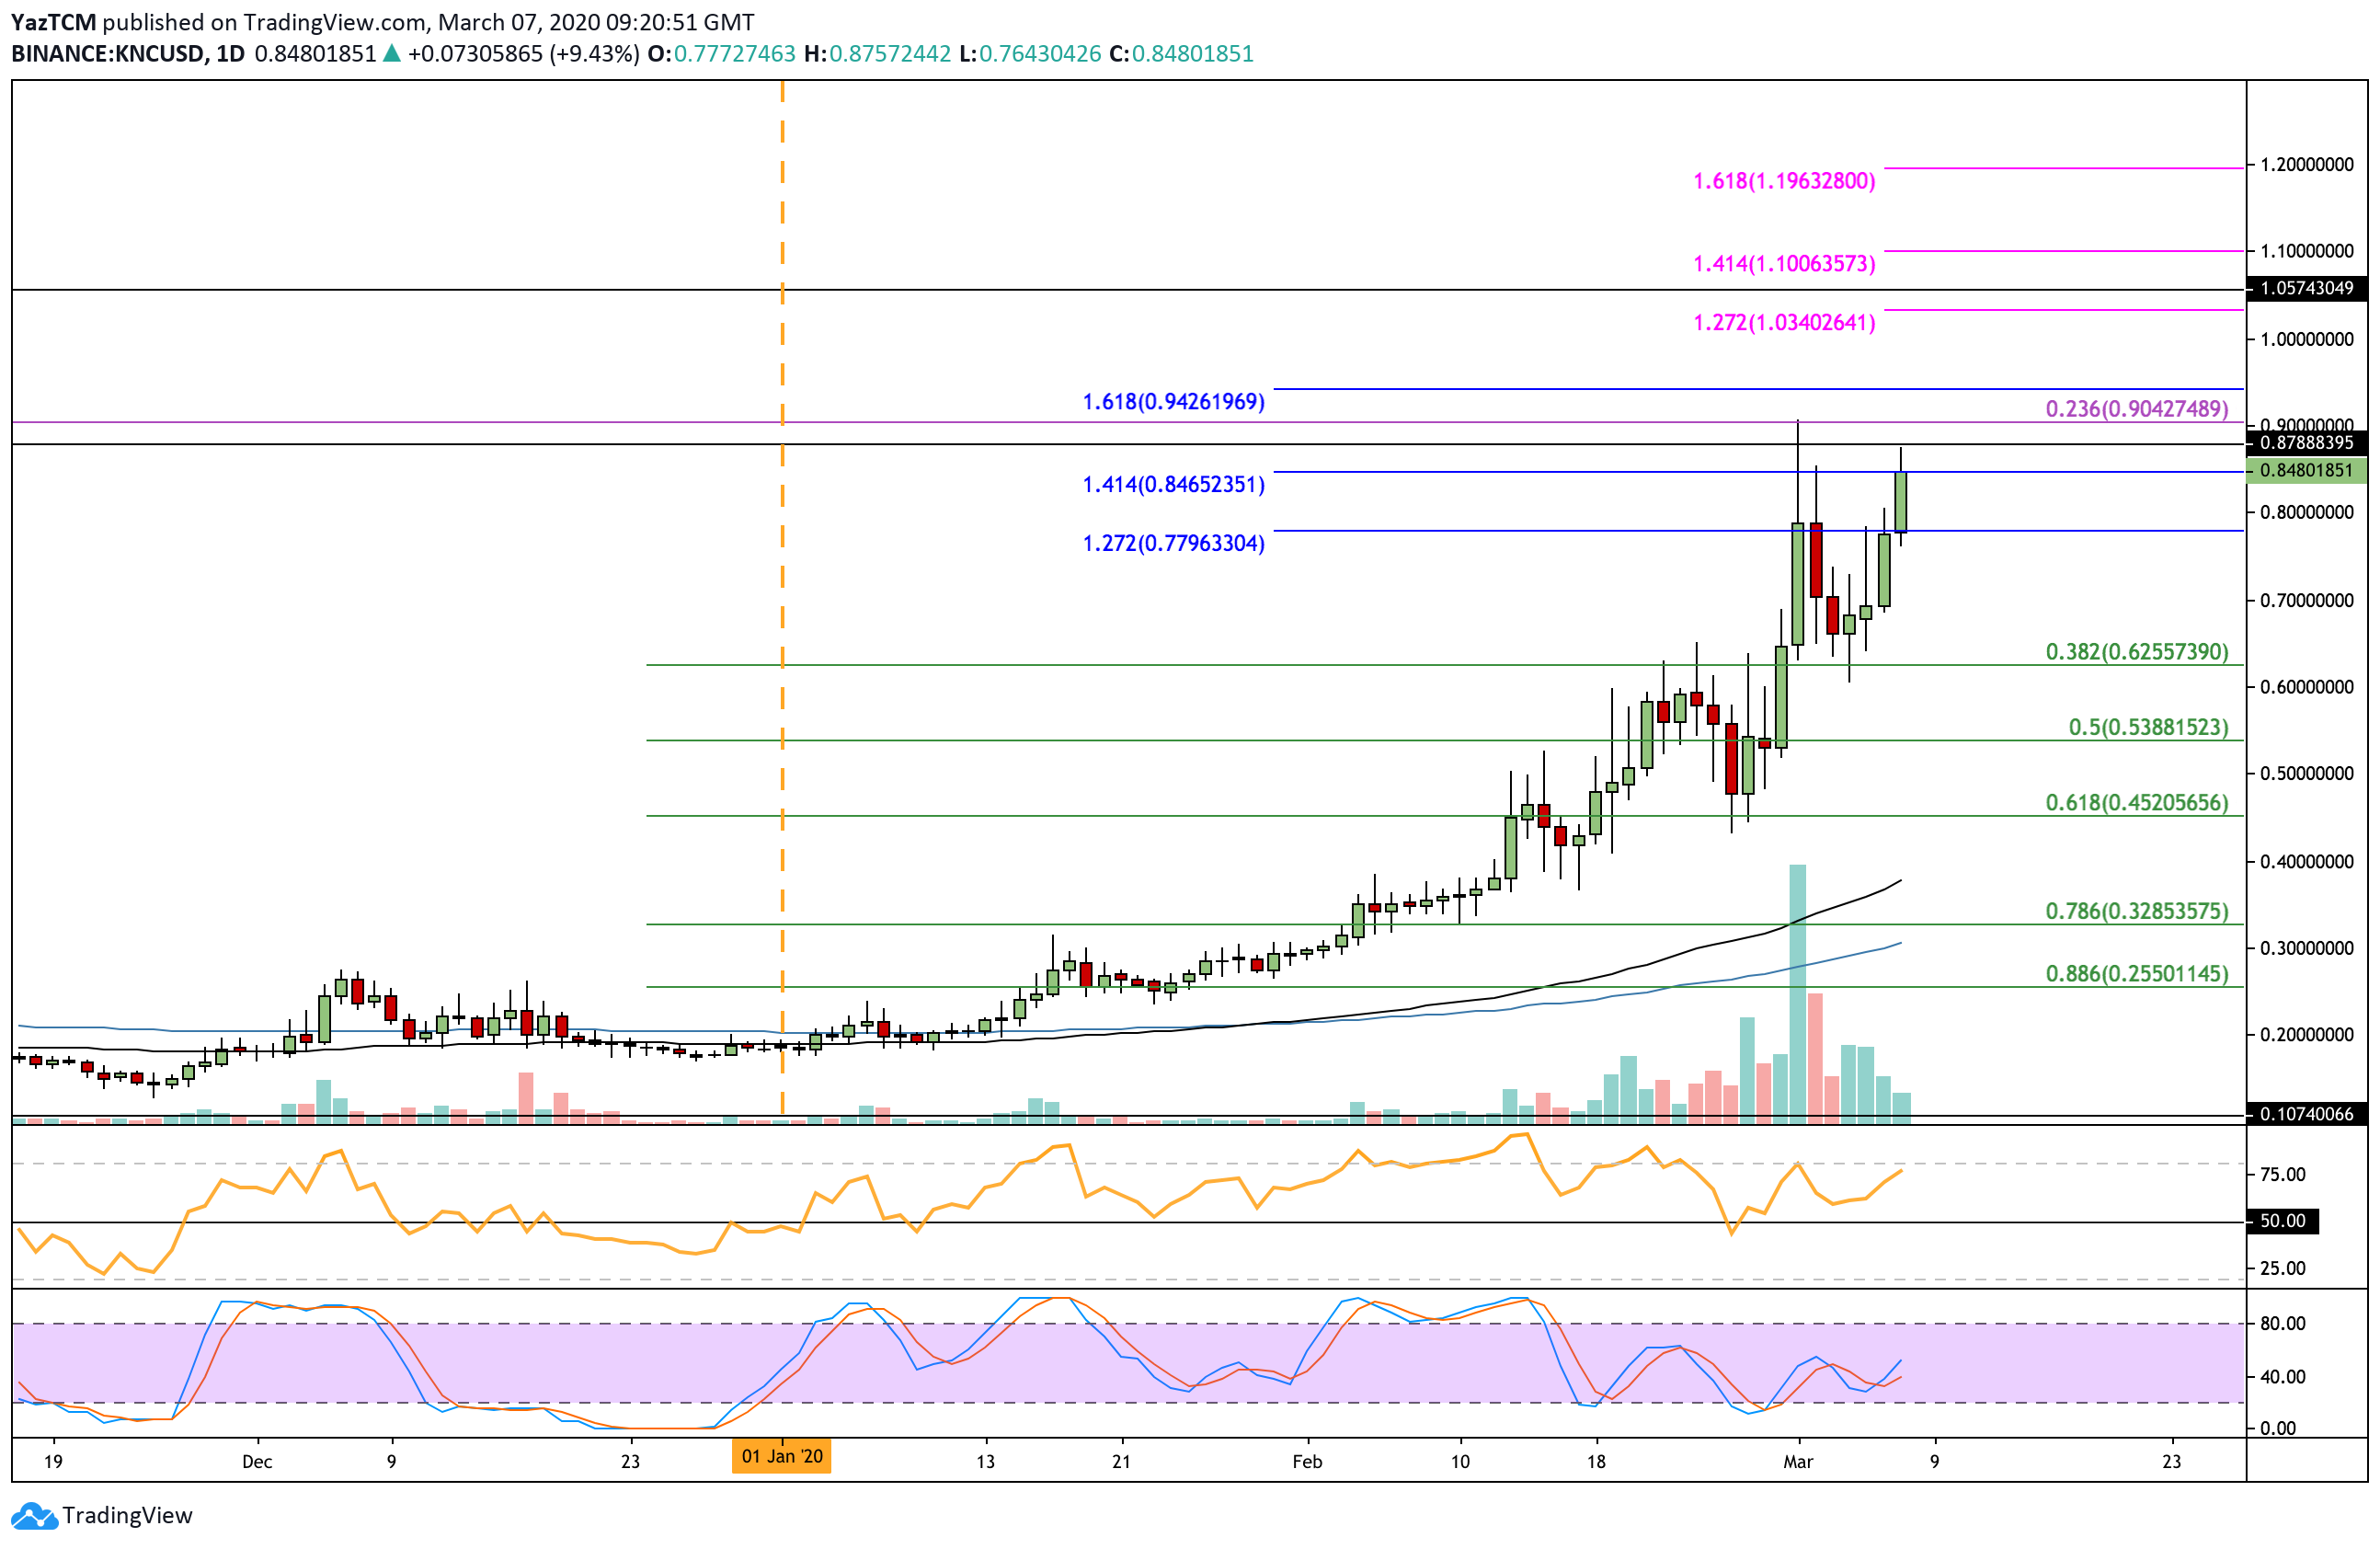
Taking a look at the daily KNC chart above, we can clearly see that KNC did not really start to move until mid-February which is actually the same time that the rest of the market started to decline heavily. The cryptocurrency started to slowly rise during February, but only truly exploded toward the start of March.
KNC bounced from support at $0.45 and increased as high as $0.90 in the first couple of days in March. It ran into resistance provided by a long term bearish .236 Fibonacci Retracement level which caused it to roll over and fall lower.
During the decline, KNC went on to find support at the .382 Fibonacci Retracement level, priced at $0.625, which allowed the cryptocurrency to rebound and push higher. It ran into resistance at $0.779, provided by a 1.414 Fibonacci Extension level, yesterday and only managed to break above it today.
We can see that KNC is now sitting at resistance at $0.846 which is provided by the 1.414 Fibonacci Extension level.
KNC price short term prediction: Bullish
After the recent explosive growth, KNC is most certainly bullish. It would need to drop beneath support at $0.452 before being in danger of turning neutral.
If the sellers do push lower, the first level of support lies at $0.80. This is followed by support at $0.70, $0.625 (.382 Fib Retracement), $0.538 (.5 Fib Retracement), $0.50, and $0.452 (.618 Fib Retracement).
What if the bulls continue pushing higher?
On the other hand, if the buyers continue to push higher, the first level of resistance lies at $0.878. This is followed by resistance at $0.90 (long term bearish .236 Fib Retracement), and $0.942 (1.618 Fib Extension). Above this resistance is located at $1.00.
If the bulls continue to breach $1.00, higher resistance lies at $1.03 (1.272 Fib Extension), $1.05, $1.10 (1.414 Fib Extension), and $1.19 (11.618 Fib Extension).
What are the technical indicators showing?
The RSI is in the bullish favor and is still far from being oversold which shows that there is still a lot of room for this market to travel further higher.
What has been going on?
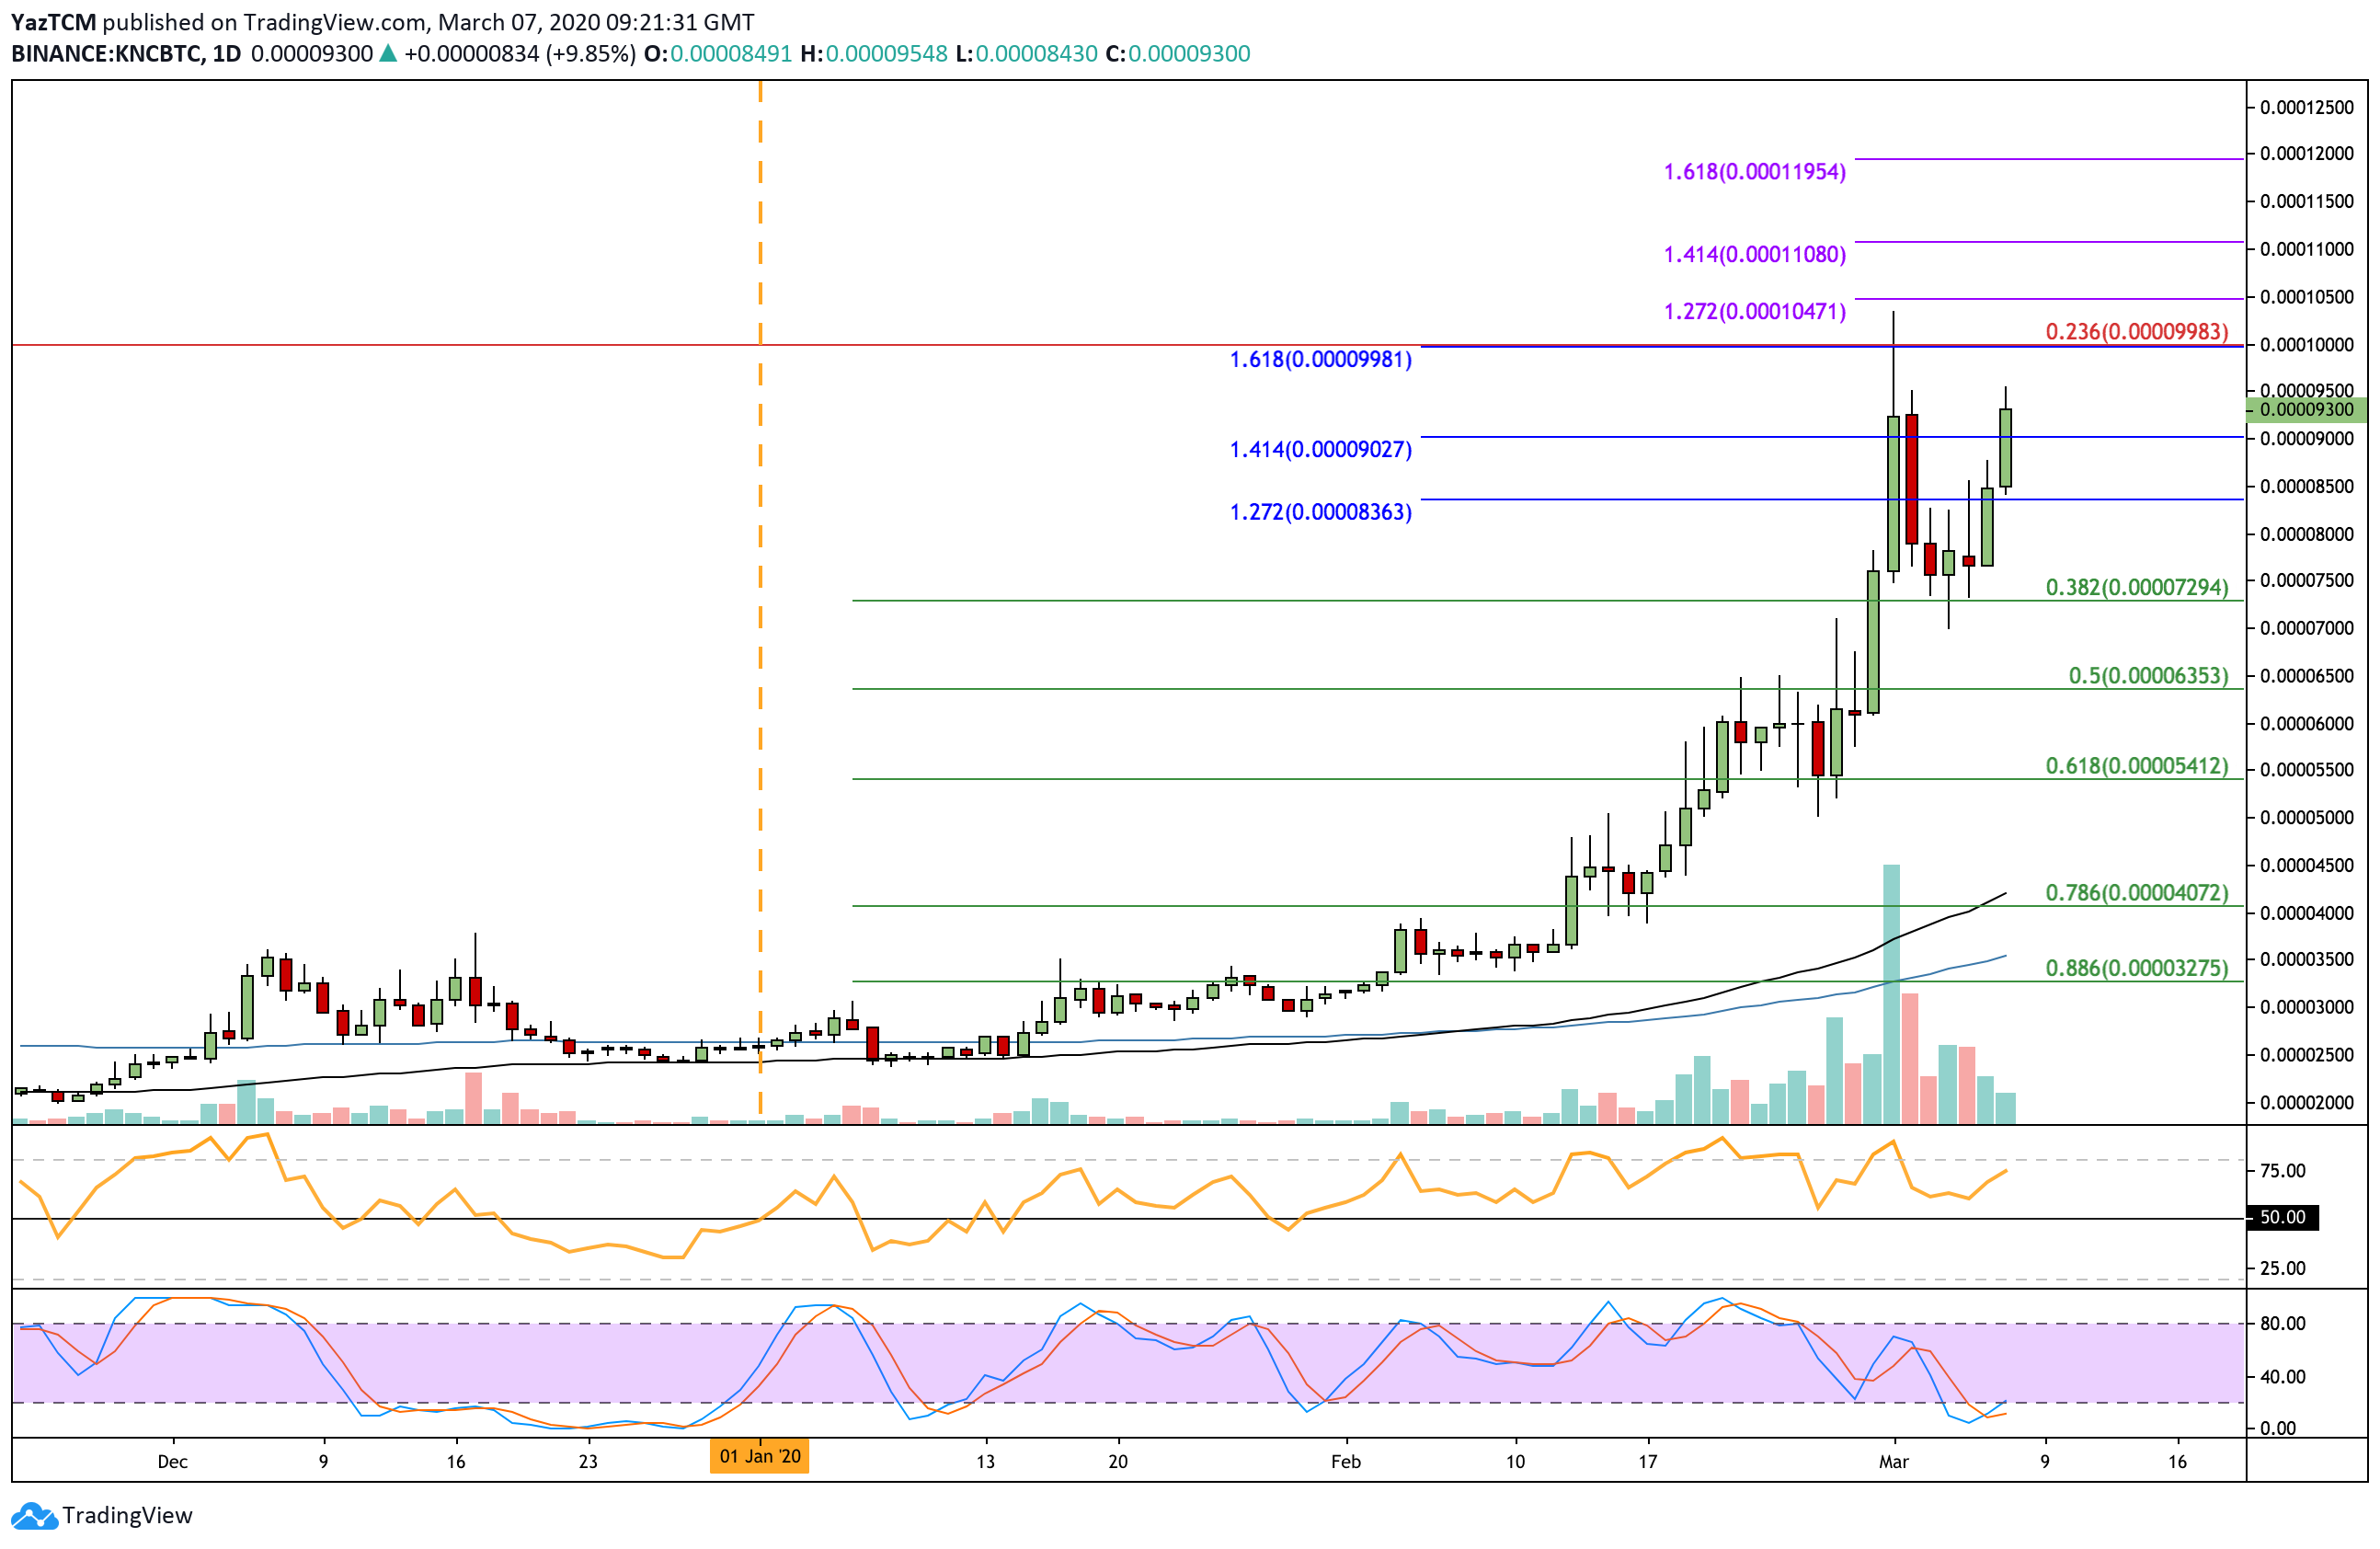
Against Bitcoin, we can see a similar scenario painted upon the charts. The cryptocurrency really started to move during mid-February 2020 as it broke above resistance at 4000 SAT. it continued to climb as high as 7300 SAT by the end of the month.
During March 2020, KNC went on to climb even higher and reached as high as 10,000 SAT before rolling over and dropping into support at 7300 SAT which is provided by a .382 Fib Retracement.
KNC has now returned back to the 9300 SAT resistance as it looks to break 10,000 SAT again.
KNC price short term prediction: Bullish
KNC can only be seen as bullish at this moment in time and would need to collapse beneath the 5000 SAT level before turning bearish.
If the sellers do push KNC lower, the first level of support is located at 8500 SAT. this is followed by support at 8000 SAT, 7500 SAT, 7300 SAT (.382 Fib Retracement), 7000 SAT, 6350 SAT (.5 Fib Retracement), and 5410 SAT (.618 Fib Retracement).
What if the bulls increase their pressure?
If the buyers push higher, the first level of strong resistance is located at 10,000 SAT which is bolstered by a long term bearish .236 Fib Retracement and a 1.618 Fib Extension. Above this, higher resistance can be found at 10,500 SAT (short term 1.272 Fib Extension), 11,000 SAT (1.414 Fib Extension), 11,500 SAT, and 12,000 SAT (1.618 Fib Extension).
undefined


