
Rising economic inequality in the United States has become a central issue in the race for the Democratic presidential nomination, and discussions about policy interventions that might help address it are likely to remain at the forefront in the 2020 general election.
As these debates continue, here are some basic facts about how economic inequality has changed over time and how the U.S. compares globally.
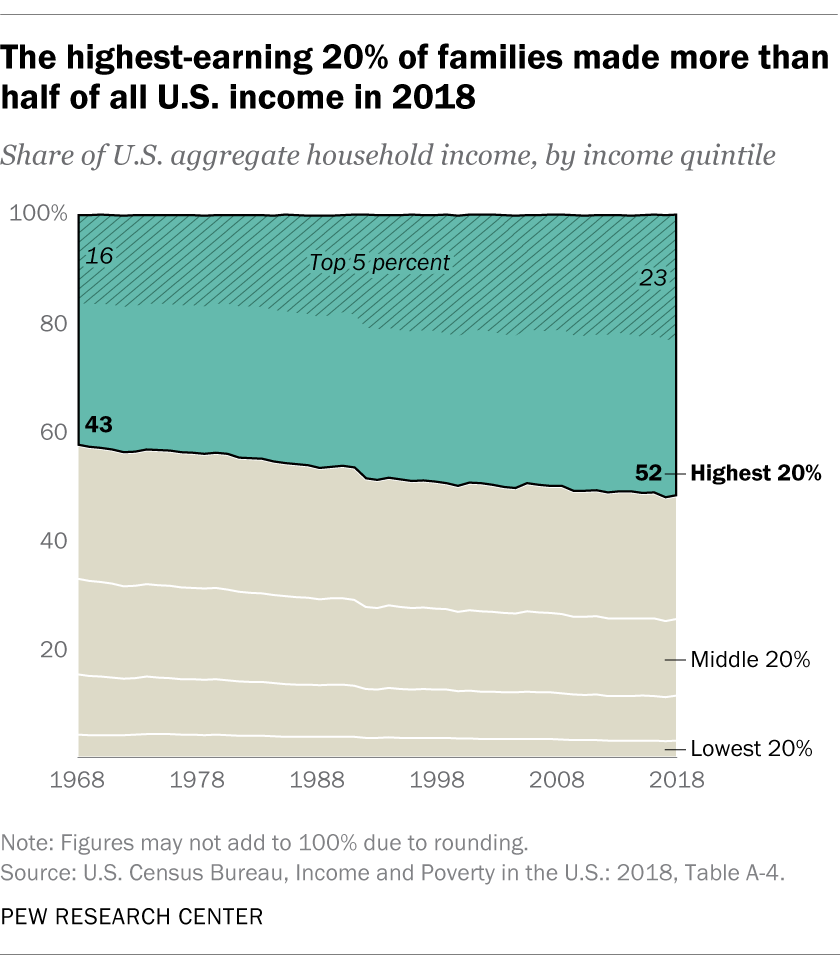
1Over the past 50 years, the highest-earning 20% of U.S. households have steadily brought in a larger share of the country’s total income. In 2018, households in the top fifth of earners (with incomes of $130,001 or more that year) brought in 52% of all U.S. income, more than the lower four-fifths combined, according to Census Bureau data.
In 1968, by comparison, the top-earning 20% of households brought in 43% of the nation’s income, while those in the lower four income quintiles accounted for 56%.
Among the top 5% of households – those with incomes of at least $248,729 in 2018 – their share of all U.S. income rose from 16% in 1968 to 23% in 2018.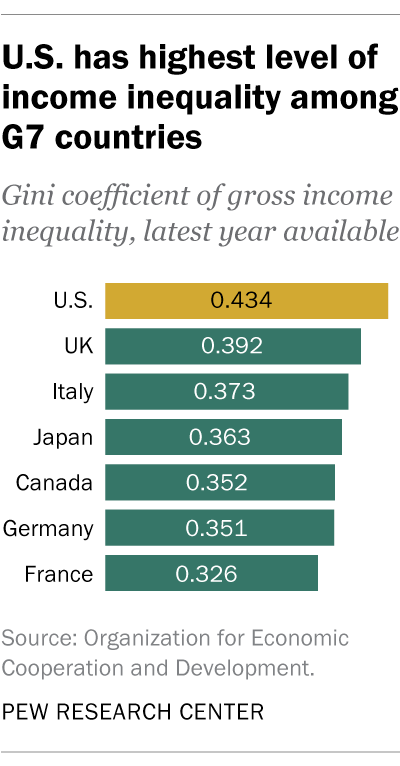
2Income inequality in the U.S. is the highest of all the G7 nations, according to data from the Organization for Economic Cooperation and Development. To compare income inequality across countries, the OECD uses the Gini coefficient, a commonly used measure ranging from 0, or perfect equality, to 1, or complete inequality. In 2017, the U.S. had a Gini coefficient of 0.434. In the other G7 nations, the Gini ranged from 0.326 in France to 0.392 in the UK.
Globally, the Gini ranges from lows of about 0.25 in some Eastern European countries to highs of 0.5 to 0.6 in countries in southern Africa, according to World Bank estimates.
3 The black-white income gap in the U.S. has persisted over time. The difference in median household incomes between white and black Americans has grown from about $23,800 in 1970 to roughly $33,000 in 2018 (as measured in 2018 dollars). Median black household income was 61% of median white household income in 2018, up modestly from 56% in 1970 – but down slightly from 63% in 2007, before the Great Recession, according to Current Population Survey data.
4Overall, 61% of Americans say there is too much economic inequality in the country today, but views differ by political party and household income level. Among Republicans and those who lean toward the GOP, 41% say there is too much inequality in the U.S., compared with 78% of Democrats and Democratic leaners, a Pew Research Center survey conducted in September 2019 found.
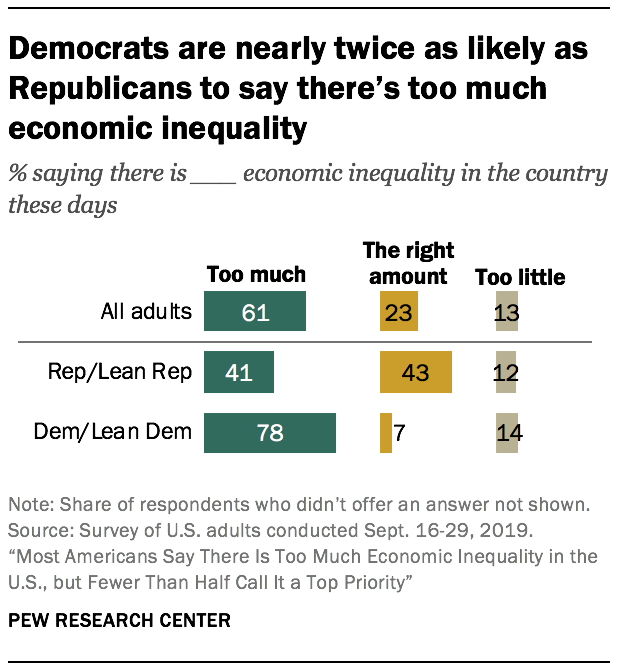 Across income groups, U.S. adults are about equally likely to say there is too much economic inequality. But upper- (27%) and middle-income Americans (26%) are more likely than those with lower incomes (17%) to say that there is about the right amount of economic inequality.
These views also vary by income within the two party coalitions. Lower-income Republicans are more likely than upper-income ones to say there’s too much inequality in the country today (48% vs. 34%). Among Democrats, the reverse is true: 93% at upper-income levels say there is too much inequality, compared with 65% of lower-income Democrats.
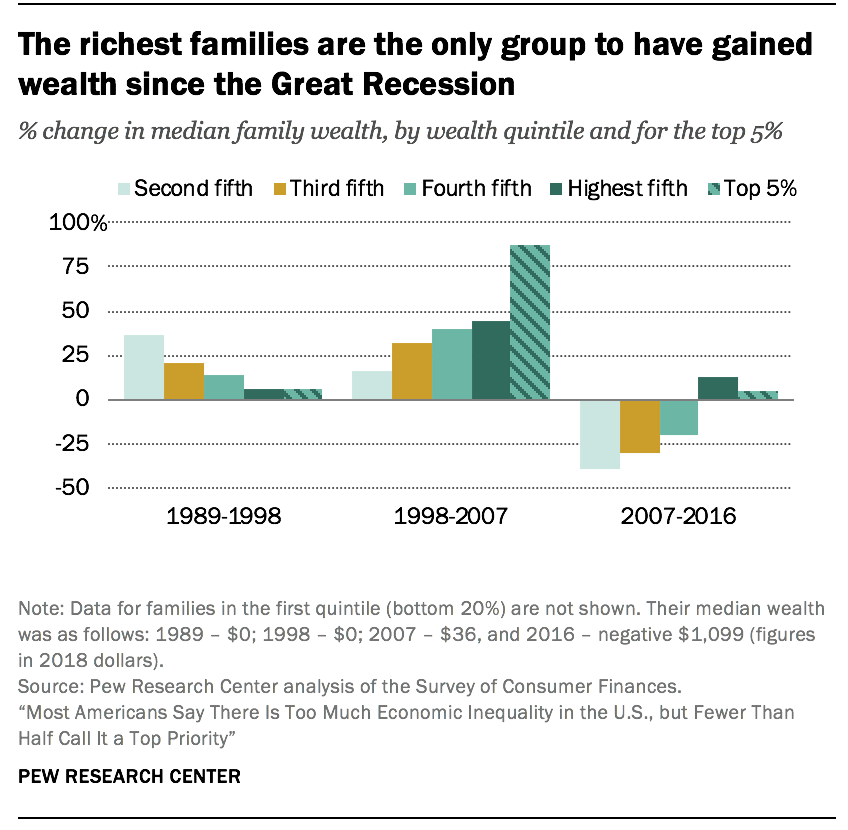 5The wealth gap between America’s richest and poorer families more than doubled from 1989 to 2016, according to a recent analysis by the Center. Another way of measuring inequality is to look at household wealth, also known as net worth, or the value of assets owned by a family, such as a home or a savings account, minus outstanding debt, such as a mortgage or student loan.
In 1989, the richest 5% of families had 114 times as much wealth as families in the second quintile (one tier above the lowest), at the median $2.3 million compared with $20,300. By 2016, the top 5% held 248 times as much wealth at the median. (The median wealth of the poorest 20% is either zero or negative in most years we examined.)
The richest families are also the only ones whose wealth increased in the years after the start of the Great Recession. From 2007 to 2016, the median net worth of the top 20% increased 13%, to $1.2 million. For the top 5%, it increased by 4%, to $4.8 million. In contrast, the median net worth of families in lower tiers of wealth decreased by at least 20%. Families in the second-lowest fifth experienced a 39% loss (from $32,100 in 2007 to $19,500 in 2016).
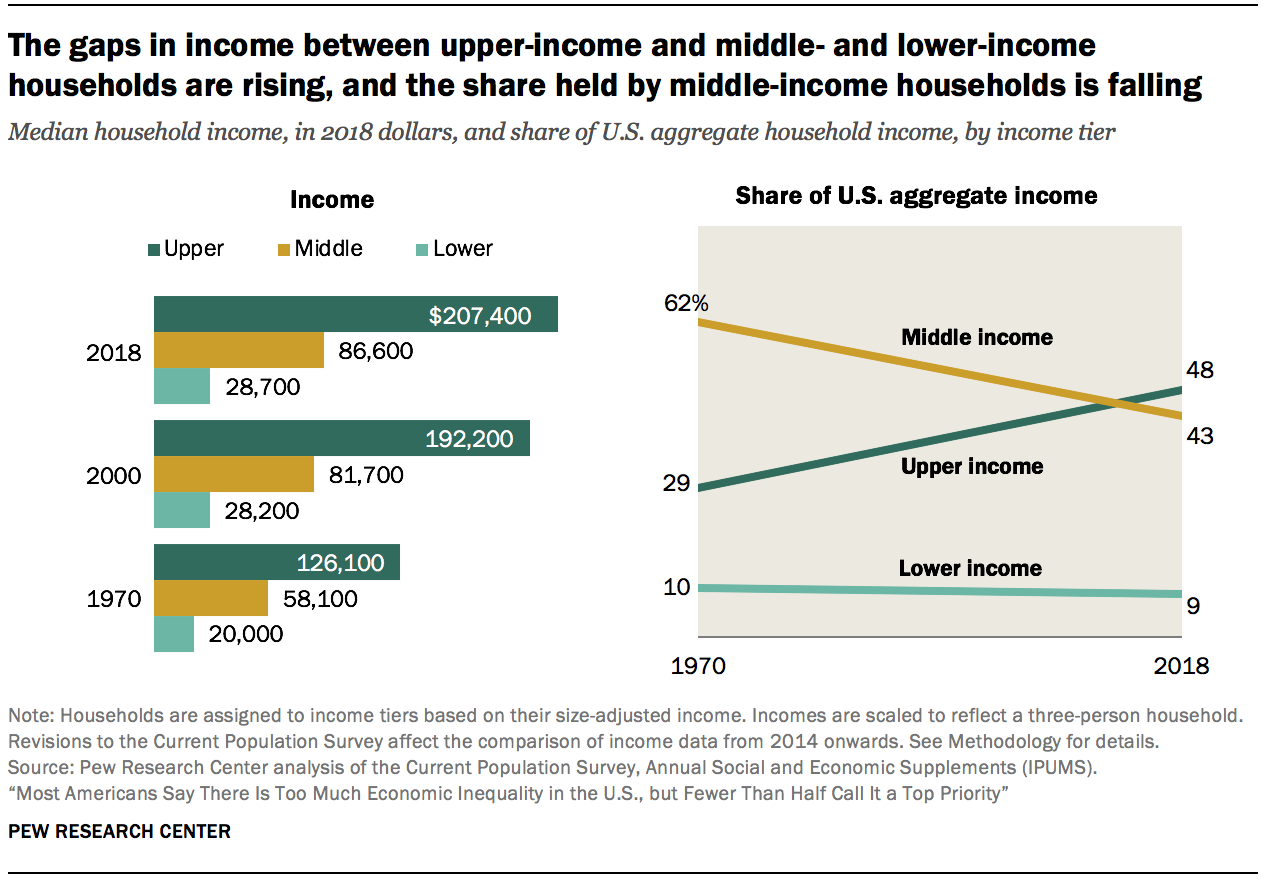
6Middle-class incomes have grown at a slower rate than upper-tier incomes over the past five decades, the same analysis found. From 1970 to 2018, the median middle-class income increased from $58,100 to $86,600, a gain of 49%. By comparison, the median income for upper-tier households grew 64% over that time, from $126,100 to $207,400.
The share of American adults who live in middle-income households has decreased from 61% in 1971 to 51% in 2019. During this time, the share of adults in the upper-income tier increased from 14% to 20%, and the share in the lower-income tier increased from 25% to 29%.


