
Most Americans (77%) say it’s more important for the United States to develop alternative energy sources, such as solar and wind power, than to produce more coal, oil and other fossil fuels, according to a recent Pew Research Center survey. Which raises the question: How does the U.S. meet its vast energy needs, and how, if at all, has that changed?
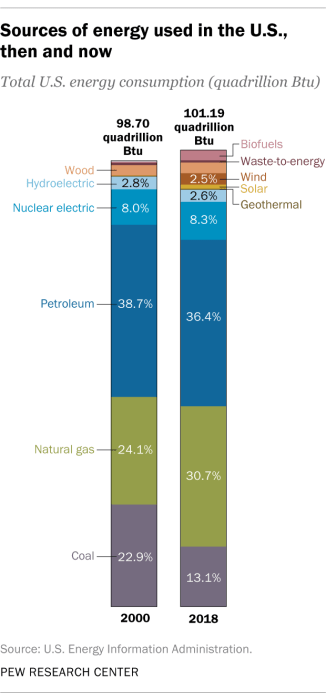
The answer, as one might expect, is complicated. Solar and wind power use has grown at a rapid rate over the past decade or so, but as of 2018 those sources accounted for less than 4% of all the energy used in the U.S. (That’s the most recent full year for which data is available.) As far back as we have data, most of the energy used in the U.S. has come from coal, oil and natural gas. In 2018, those “fossil fuels” fed about 80% of the nation’s energy demand, down slightly from 84% a decade earlier. Although coal use has declined in recent years, natural gas use has soared, while oil’s share of the nation’s energy tab has fluctuated between 35% and 40%.
The total amount of energy used in the U.S. – everything from lighting and heating homes to cooking meals, fueling factories, driving cars and powering smartphones – hit 101.2 quadrillion Btu in 2018, the highest level since data collection began in 1949, according to the federal Energy Information Administration (EIA).
(Short for British thermal unit, Btu is often used in the energy industry – not to mention the home-appliance business – as a common yardstick to measure and compare different types of energy. One Btu is the amount of energy needed to heat 1 pound of water by 1 degree Fahrenheit at sea level. It’s equivalent to about 1,055 joules in the metric system, or the heat released by burning a common wooden kitchen match.)
How we did this
About 38% of all those Btu flowed into the electric power industry (electric utilities and independent power producers), which converted them into electricity and sent them back out into the rest of the economy. Transportation accounted for about 28% of total energy use, followed by the industrial sector (23%), households (7%) and commercial establishments (less than 5%).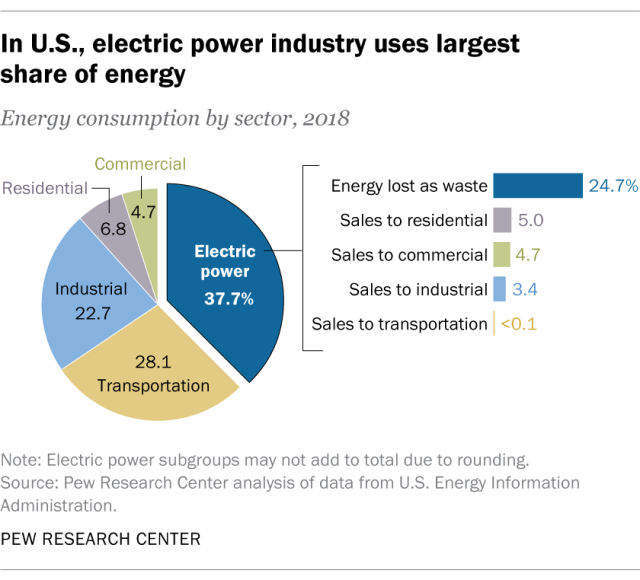 Per capita energy use in the U.S. had been trending lower since the turn of the 21st century but ticked up in 2018. On average, each American in 2000 used about 349.8 million Btu. By 2017 that had fallen to 300.5 million Btu, the lowest level in five decades. In 2018, though, per capita energy use rose to 309.3 million Btu. (Per capita energy use peaked in 1979 at 359 million Btu.)
Looked at a different way, the U.S. economy has become steadily less energy-intensive since the end of World War II. In 1949, it took 15,175 Btu to generate each dollar of real gross domestic product. By 2018, it took 5,450, a 64% decrease. But there’s still plenty of inefficiency in the system: The Lawrence Livermore National Laboratory calculated that in 2018, about two-thirds of all the energy used was wasted (as with heat exhaust from vehicles and furnaces). And only 34.5% of the energy used by the electric power industry reaches end users as electricity – the rest is lost in the process of generating, transmitting and distributing the power.
Oil and natural gas production up, coal down
Today, the United States meets nearly all its energy needs through domestic production. Net imports, mainly petroleum, accounted for less than 4% of the total U.S. energy supply in 2018, versus 26% a decade earlier.
In the first 10 months of 2019, the U.S. pumped nearly 3.7 billion barrels of crude oil, more than 2 billion more than in the same period in 2009, according to EIA data. For the full year 2018, crude accounted for nearly a quarter of all U.S. energy production. Natural gas, which accounted for about a third of total energy production in 2018, has also soared – from 21.7 trillion cubic feet in the first nine months of 2009 to 33.6 trillion cubic feet in the same period in 2019.
Those dramatic increases in domestic oil and gas production have been driven by new technologies, most notably fracking and horizontal drilling, which enable companies to access underground deposits that previously were too expensive to tap. As a consequence, the U.S. was the world’s biggest producer of both oil and gas in 2018 – ahead of Saudi Arabia and Russia, respectively.
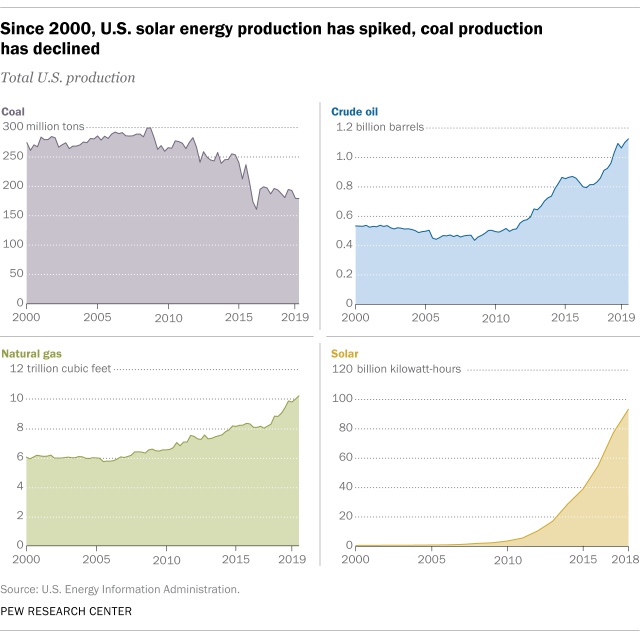
Coal, on the other hand, has declined precipitously since its 2008 peak, when nearly 1.2 billion tons were mined. Nearly all U.S. coal (about 93% in 2018, according to EIA data) is used to generate electricity. But as a Brookings Institution report notes, U.S. electricity demand has been stagnant, the price of natural gas has fallen as production has soared, and government policy has until recently favored other energy sources such as wind and solar. In 2018, coal accounted for just 16% of total domestic energy production, less than half its share a decade earlier. The amount mined in the first nine months of 2019, 540 million tons, was about a third lower than in the same period in 2009.
Over the past decade, solar power has experienced the largest percentage growth of any U.S. energy source. Solar generated just over 2 billion kilowatt-hours of electricity in 2008. A decade later, it generated more than 93 billion kilowatt-hours, an almost 46-fold increase. Solar’s growth is occurring on both the large scale (electric power plants) and the small scale (rooftop solar panels). Overall, about two-thirds of all solar energy was produced by electric utilities, with solar setups on homes and commercial buildings accounting for most of the rest.
Still, solar accounted for only 1% of the nation’s total energy production in 2018. The biggest renewable energy source remained hydropower (2.8% of total production), followed by wind, wood and biofuels.


