
XLM Price Analysis – January 9
The XLM/USD is still looking bearish despite all indication for positive moves and the coin is now looking around for a surge.
XLM/USD Market
Key Levels:
Resistance levels: $0.052, $0.054, $0.056
Support levels: $0.042, $0.040, $0.038
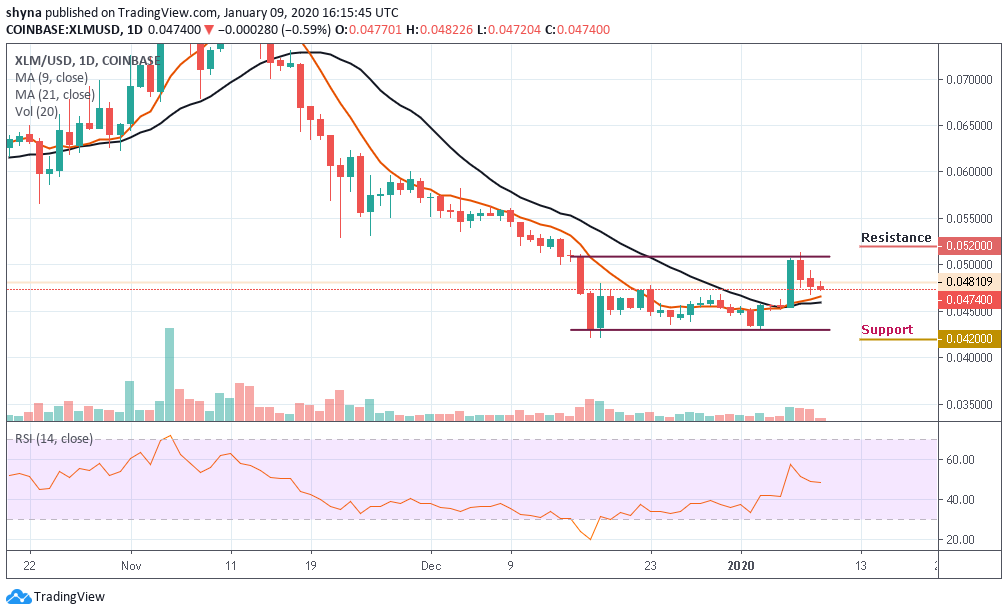
Looking at the daily chart, the XLM/USD pair continued to maintain a downward trend within the channel. The coin has been moving in sideways since December 18, 2019, and couldn’t break out or break down. Currently, the market is down by 0.59% and the price of Stellar will continue to fall as long as the selling pressure remains on the market. For now, the 9-day and 21-day moving averages at $0.045 are serving as support for the coin.
Meanwhile, if the bulls could push it to the north, it may likely reach the resistance level of $0.052, $0.054 and $0.056 to maintain the uptrend. Conversely, the coin is close to short-term support at $0.045. A significant drop below this support may result in new technical support at $0.042, $0.40 and $0.038.
At the moment, the MACD signal lines are still within the negative side, moving to the positive side may boost the upward trend for the coin.
XLM/BTC Market
Against BTC, the market is seen to be moving below the 9-day and 21-day moving averages within the descending channel where the price is expected to cross the moving averages. Should the price break above the upper side of the channel, then, the market may experience an upward trend that could touch the nearest resistance level of 650 SAT and above.
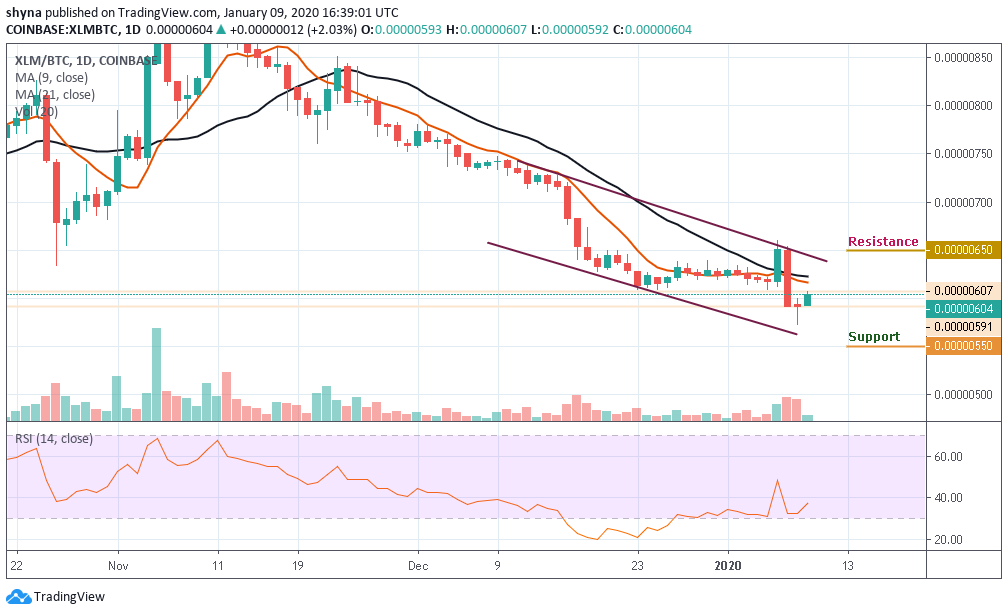
Nevertheless, if the XLM price crosses down the bottom line of the channel, the coin is expected to reach the support at 550 SAT and below. But as confirmed by the RSI (14) indicator, the market is coming out of the selling pressure as its signal line is about to cross above the 40-level.
Please note: Cryptovibes.com is not a financial advisor. Do your research before investing your funds in any financial asset or presented product or event. We are not responsible for your investing results.


