
- EUR/USD is trading in tiny ranges ahead of the FOMC rate decision at 19:00 GMT.
- Immediate support is located 1.1062, while resistance is at the 1.1100 level.
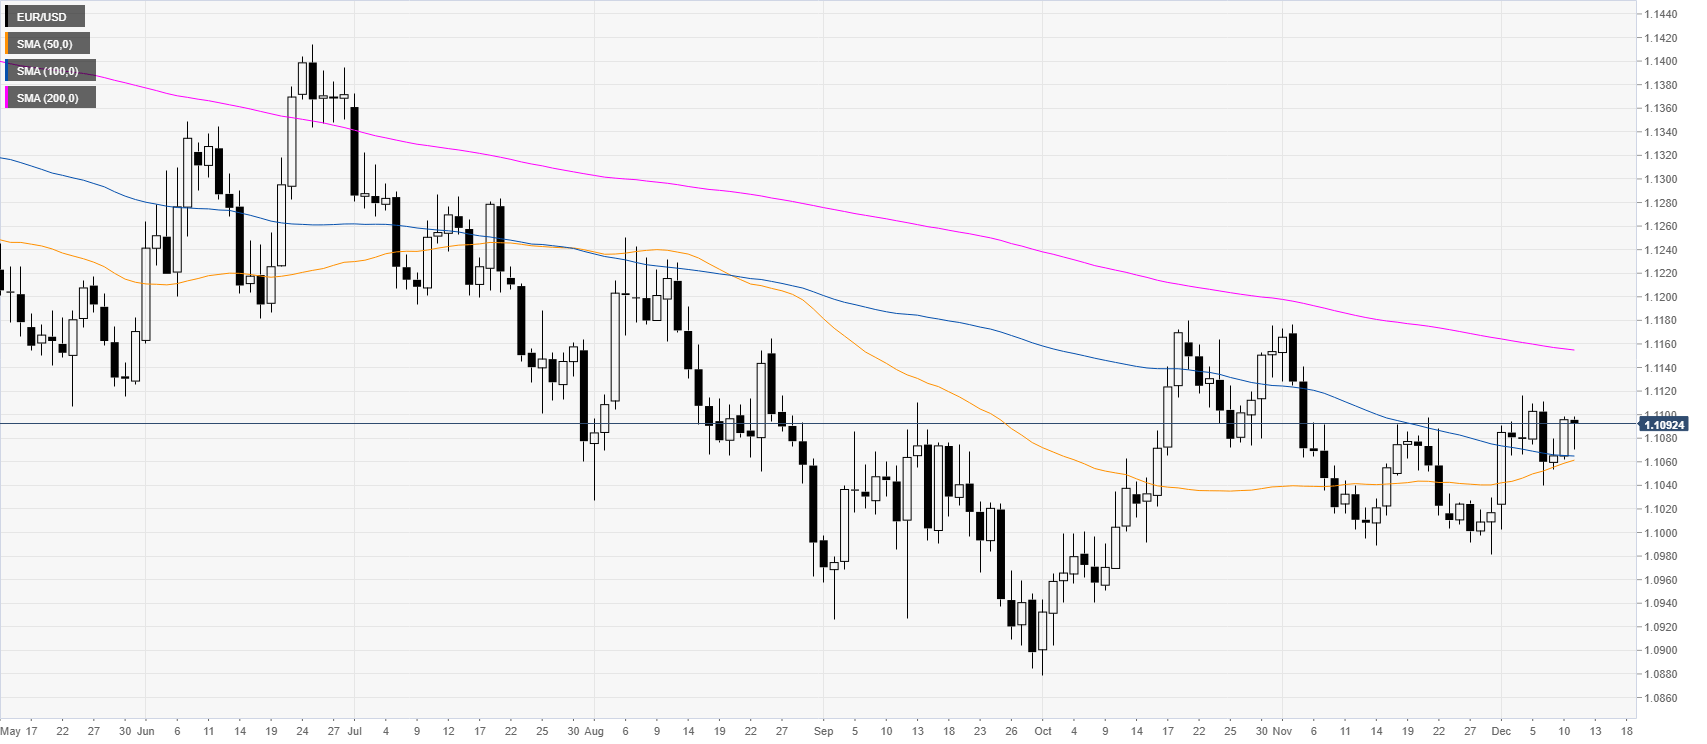
EUR/USD daily chart
The shared currency, on the daily chart, is trading in a downtrend below the 200-day simple moving average (DMA). However, at the start of December, the market had a strong bullish reversal. The market has been in a tight correction since then. Earlier in the New York session, the Consumer Price Index ex Food & Energy (YoY) came in line with expectations at 2.3% in November. However, investors are waiting for the FOMC at 19:00 GMT and the press conference at 19:30 GMT.
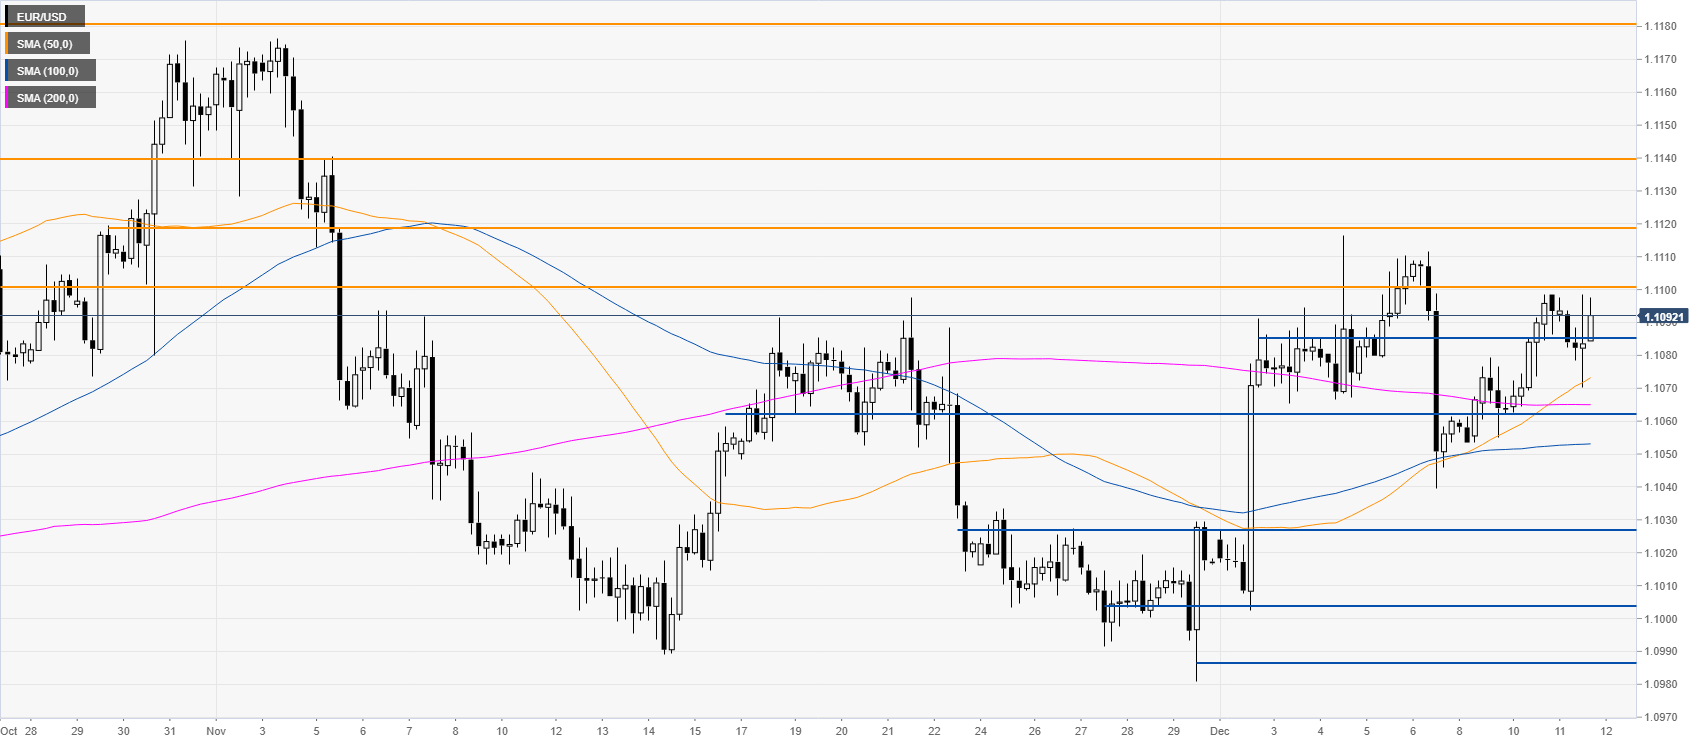
EUR/USD four-hour chart
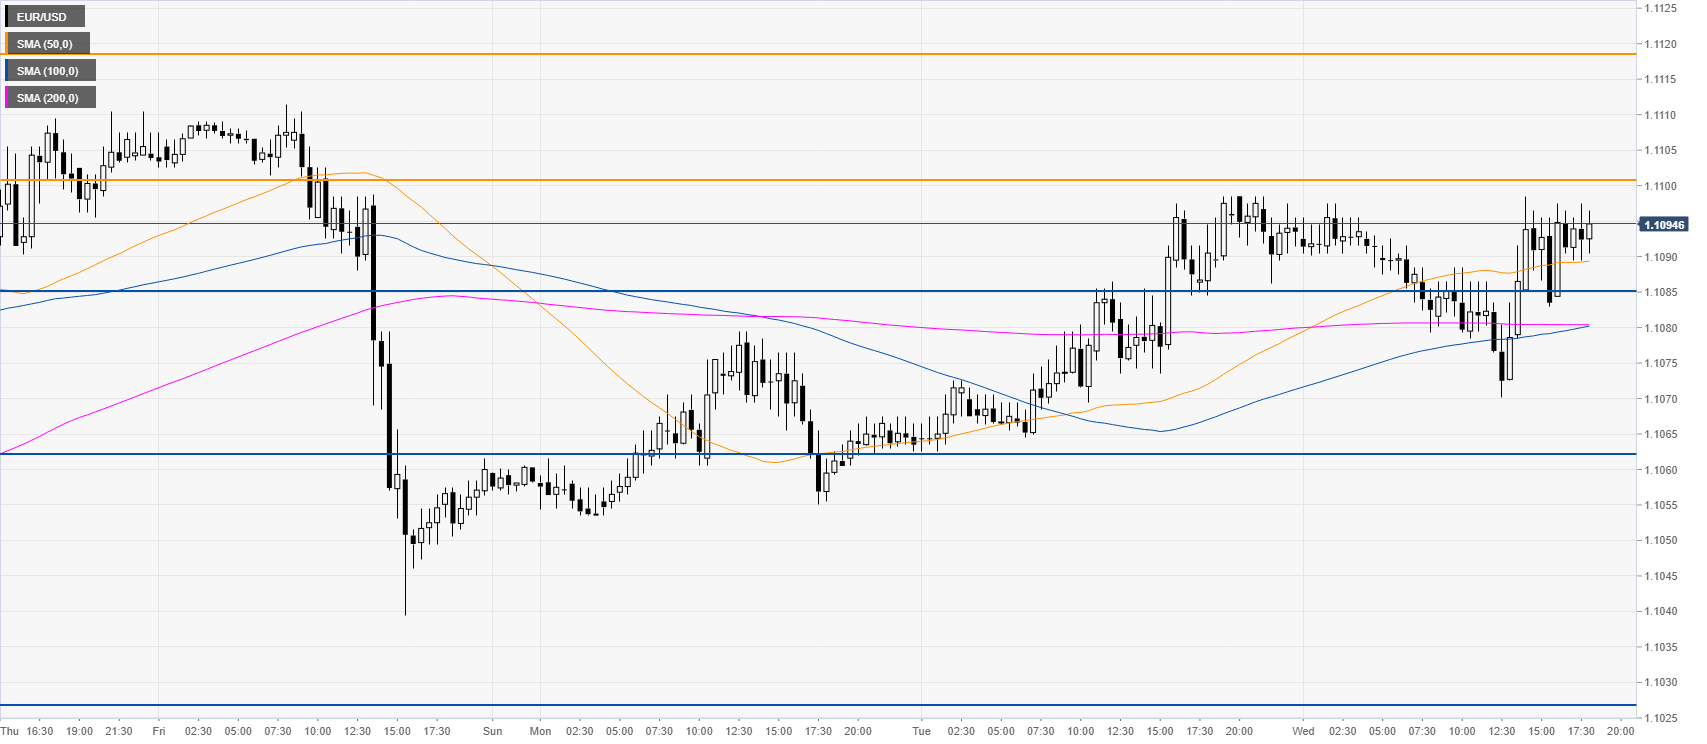
EUR/USD 30-minute chart
The euro is trading above its main SMAs. However, the market has been ranging for almost two weeks. Sellers would gain momentum on a daily close below the 1.1062 support. A breakout below this level could see the 1.1027, 1.1004 and 1.0987 levels revisited, according to the Technical Confluences Indicator.
Additional key levels


